

The domestic equity market has experienced a period of significant volatility in recent years. Nick Seeto and Justin Harsel look at an investment strategy that can help better manage the effect of these fluctuations.
Australian equities have experienced a great deal of price fluctuation during their recovery from the global financial crisis, leaving many investors wondering how they can best manage their portfolios in this uncertain environment. In this article, we take a look at volatility and how to use it in a dynamic allocation strategy to:
- reduce downside risk,
- control portfolio volatility, and
- improve risk-adjusted returns.
What is volatility?
Put simply, volatility measures how much the price of an asset fluctuates. The greater the deviations, the riskier the asset due to the uncertainty about the range of variations. Compare walking home after work on a normal weekday and walking home on a Friday night after some cold beverages – the latter scenario is more volatile than the other. Similarly, an asset’s volatility can be affected by economic news, corporate actions, natural disasters and price action caused by exogenous events originating in another market.
As the adage goes, if Asia or the United States sneezes, the Australian market catches a cold.
As a rule of thumb, low-volatility assets usually include bonds and cash deposits, with a volatility of between 1 per cent and 10 per cent, medium-volatility assets are typically large market cap equities, such as those in the S&P 500, with a volatility of between 11 per cent and 20 per cent, while higher volatility is experienced by more speculative markets, such as commodities and emerging markets, with volatility in excess of 20 per cent.
Table 1: Volatility of different markets from May 2005 to May 2015 measured over daily returns
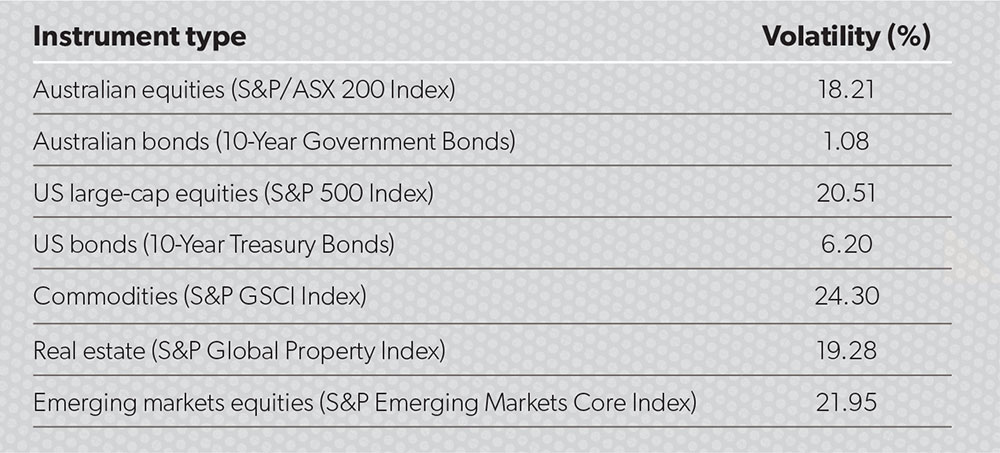
Source: Standard and Poor’s
Volatility and the performance of the Australian market
The graphs over the page show the volatility at different stages of the economic cycle.
Significant market events are circled, in order: bond market crash (1994), Asian financial crisis (1997), Russian financial crisis (1998), dot-com bubble (2000), September 11 (2001), continuation of the correction (2002), global financial crisis (2007-09), European sovereign debt crisis (2010), US credit rating downgrade (2011).
Figure 1: S&P/ASX 200 Accumulation Index
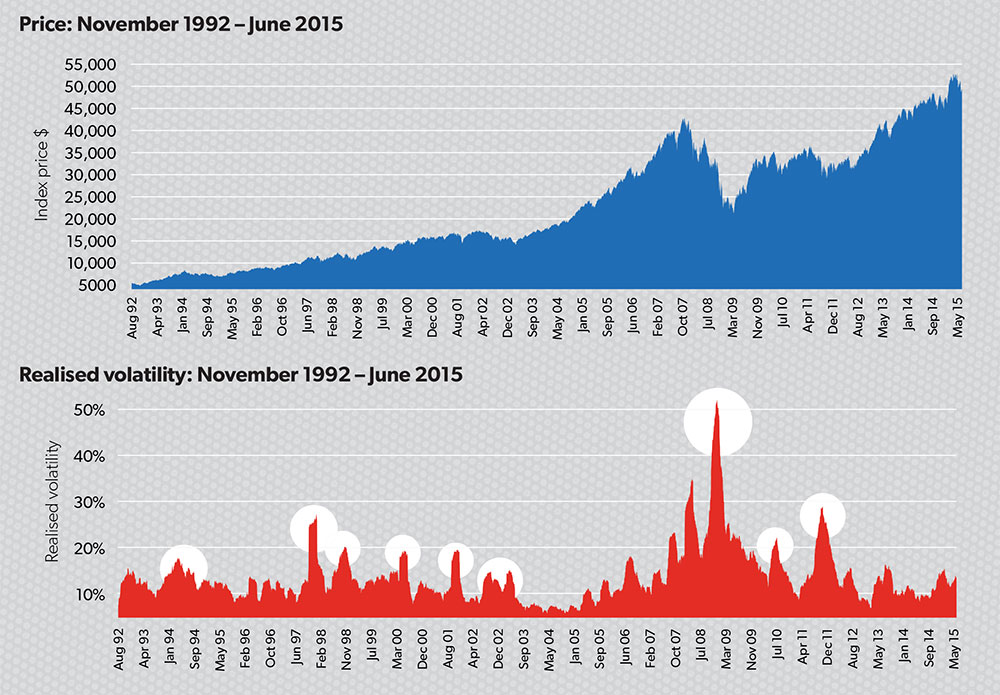
Source: Standard and Poor’s
Different types of volatility
There are two types of volatility: realised and implied. Realised volatility (also called historical or actual volatility) is usually calculated based on the historical daily returns over a specific time period, for example, three, six or 12 months. Implied volatility, used in trading options, is an issue to be discussed at a different time. In this article, we will be discussing realised volatility.
Volatility begets volatility
Legendary mathematician Benoit Mandelbrot was one of the first to notice volatility clustering in financial instruments in his article, “The variation of certain speculative prices”, published in theJournal of Business in 1963. Mandelbrot stated large changes tended to be followed by large changes and, similarly, small changes tended to be followed by small changes.
Furthermore, Robert Engle, in his work, “Risk and volatility: econometric models and financial practice”, published in The American Economic Review in 2003, which won him the Nobel Prize for Economic Sciences, mentions volatility clustering is a phenomenon that results from the clustering of new information arriving to the market.
Generally speaking, a period of low volatility is followed by low volatility and vice versa for high-volatility regimes.
Correlation between volatility and asset returns
In 1976, Fisher Black (known as a bit of rock star in the financial world thanks to the Black-Scholes-Merton option model) coined the phrase ‘leverage effect’ in his piece, “Studies of stock price volatility changes”. The leverage effect refers to a well-established negative relationship between asset volatility and returns. In short, if the equity, or share price, in a company falls and the amount of debt it uses stays the same, by definition the leverage has increased. Similarly, if there is a drop in Sydney house prices while the level of borrowings remains the same, then there is likely to be an increase in volatility of prices as people rush to sell. In summary, there is a strong relationship between negative market returns and increased volatility. The strategy outlined below aims to use this relationship to manage portfolio risk in volatile conditions.
The volatility control strategy
One of the other ways to manage risk exposure is through the volatility control strategy (VCS). This strategy aims to target a particular volatility level over the entire investment period. We will now work through an example portfolio where the investor holds an investment in the S&P/ASX 200 Accumulation Index and test it against a range of volatility scenarios.
The long-run realised volatility of the S&P/ASX 200 Accumulation Index is about 16 per cent (based on long-term volatility between 1992 to 2015), which implies roughly a 1 per cent daily move (calculated by dividing the annualised volatility by the square root of 252 trading days per year). What the investor needs to decide is roughly how much daily deviation they are comfortable with. At the end of the day, people want a degree of certainty when watching their portfolio grow rather than enduring a Bear Grylls-style adventure that involves traversing black caiman infested rivers in the Amazon.
In this example, we choose a conservative level: a 10 per cent annualised volatility target, which implies a 0.63 per cent daily move. We also assume we are not using leverage, so the exposure is limited to 100 per cent. Only one calculation needs to be done. With the 10 per cent volatility control target and a 100 per cent cap on exposure, the risk weight is simply:
Risk weight =
Minimum of (100%, [10% volatility target])
––––––––––––––––––––––––––––––––––
Realised volatility
Let’s say realised volatility is currently at 12 per cent.
Using the formula above, we would have a risk weight of 83.33 per cent (10 per cent volatility target/12 per cent realised volatility), while 16.67 per cent is in a riskless asset (for example, cash). In reality, the investor could sell 16.67 per cent of the asset and deposit the proceeds into a cash account or keep the holdings at 100 per cent, but offset that position by selling another asset linked to the same underlying asset (like an SPI 200 future or the STW ETF if you are invested in the S&P/ASX 200 basket of stocks) with a portfolio weight of 16.67 per cent.
What if the market falls and realised volatility spikes to 20 per cent?
This would mean that in order to maintain the portfolio volatility target of 10 per cent, you would need to reduce the risk weight to about 50 per cent (that is, 10 per cent volatility target/20 per cent realised volatility).
Following the fall, the market has a bounce and realised volatility drops to 9 per cent.
We need to adjust our exposure levels and given that we have capped exposure to 100 per cent, our risk weight increases to 100 per cent (minimum of 100 per cent and 10 per cent volatility target/9 per cent realised volatility = 111 per cent).
How often does the strategy need to be reweighted? Transaction costs and the time required to attend to portfolio management are important. Recalculating the risk weight once a month may be a good place to start.
Risks
Assuming the investor follows the normal capped version of 100 per cent exposure, there is a chance they will underperform in a rally if they don’t have full exposure. Conversely, the worst-case scenario in a market downturn is that they will be 100 per cent exposed to the underlying asset and experience the same losses as an owner who is fully invested.
While the strategy aims to keep the volatility of the portfolio stable around a particular level, it can at times exceed the target.
The reactionary nature of the risk weight calculation also means that it can take some time for it to adjust to new market events.
The strategy is what is known as systematic (or algorithmic if you wish to sound cutting edge) as it involves following predetermined rules. While there aren’t really that many rules to follow in the VCS, there may be times when it signals the investor to do something that could be considered counterintuitive, such as selling in a falling market or buying into a rally.
Why you should consider it?
There are several reasons why the strategy should be considered, including:
- The strategy dynamically adjusts the risk allocation as new price information arrives.
- Risk and drawdown management is achieved by controlling the portfolio volatility.
- It does not rely on complex black box models or the intuition of ‘market experts’.
- Rules-based investing can remove part of the emotional aspect of the decision process.
- The monthly portfolio rebalancing approach allows for cost-effective risk management.