


Ben Anderson provides an update on the current status of the domestic residential property market.
In November last year, Sydney yet again posted a 1 per cent rise in home values as the combined capital city home values increased by 8.5 per cent over the 12 months to November 2014.
However, the market was showing signs of slowing into the Christmas/summer period after a peak in growth of 11.5 per cent in April 2014.
Residential property in Australia is the nation’s single largest and most valuable asset class, with a total estimated value of $5.6 trillion as at October 2014. The value of residential property is significantly larger than the value of listed equities ($1.6 trillion), Australian superannuation ($1.8 trillion) and commercial real estate ($0.7 trillion).
Over the 12 months to June 2014, Australian gross domestic product was $1.57 trillion, indicating the value of residential property is more than three times larger than the annual output of the Australian economy.
Historically speaking, mortgages have generally performed well with low arrears, strong return on equity, consistent earnings, risk transfer benefits from higher risk loans generally insured via lender’s mortgage insurance, a general upward trend in home values and the fact Australians tend to prioritise mortgage repayments.
Of course, the high level of mortgage lending has contributed to the bidding up of property values and the subsequent high level of housing debt.
Over the past two-and-a-half years, combined capital city home values have been rising.
The level of value growth experienced has been mixed across capitals, however, the two largest capitals, Sydney and Melbourne, both recorded the strongest capital growth conditions of all capital cities.
According to RP Data, home dwelling values across Australia’s capital cities fell by 0.3 per cent over the month of November 2014, however, the majority of capital cities experienced modest growth (Sydney 1.0 per cent, Brisbane 0.4 per cent, Perth 0.9 per cent and Hobart 0.2 per cent).
In the three months to November, home values rose on average 0.8 per cent nationally, suggesting the rate of growth is slowing. All capital cities experienced lower growth than their recent peak, apart from Hobart.
Sydney and Melbourne remained the dominant players in the property market, where annual value growth peaked at 16.7 per cent in April 2014 and at 11.9 per cent in January 2014 respectively. The two states remained the main drivers of value growth in the 12 months to November.
The Sydney residential market continued to be strong in the 12 months to November. Over the year, Sydney and Melbourne home values increased by 13.2 per cent and 8.3 per cent respectively, with Melbourne’s growth remaining higher than the third strongest performing city for capital growth, Brisbane.
The Queensland capital recorded a 6.2 per cent increase over the same time frame and Hobart (5.2 per cent) was the only other capital city to record annual value growth in excess of 5 per cent.
We have seen residential property prices go from strength to strength, with market demand far exceeding supply. Investor activity continues to be at strong levels, taking advantage of record low interest rates, which had been on hold for a record sixteenth consecutive months in December.
Western Sydney has recorded consistent growth, showing little sign of slowing, and demand is continuing to outstrip supply. The main drivers for growth have been low interest rates, limited stock and high demand.
The suburb of Seven Hills as an example experienced 24 per cent growth in home values in the 12 months to July 2014, according to Australian Property Monitors. However, according to RP Data, Sydney in recent months has experienced lower rental returns, suggesting investors are chasing capital growth.
Investors who purchased two years ago have enjoyed strong value growth, however, investment is now spiking and at a time when the growth cycle is very mature and rental yields are around historic lows. Over the past five years, Sydney has experienced the greatest total housing value growth of the four largest capital cities.
The property price point in excess of $1 million is a different story, with most areas having experienced between 10 per cent to 15 per cent growth in the 12 months to November, with most properties under $2 million moving ahead in leaps and bounds as investors are now making up a record percentage of buyers.
City fringe suburbs continue to undergo further urban renewal project development capitalising on zoning changes from industrial to residential, especially high density suburbs such as Botany, Alexandria and Hillsdale, which represent great investment opportunities for first-time and seasoned property investors.
We have also noticed increased auction clearance rate activity and overall sales closures in the prestige market.
Last year was red hot in the Melbourne residential sector. When comparing current median house prices to those in 2013, the results are a staggering $91,000 increase in the median housing price, with an annual growth of 16.34 per cent for the year to date based on recent results released by the Real Estate Institute of Victoria (REIV).
Although the Melbourne market is considered second only to Sydney in terms of housing price growth, the results have shaped a well-supported and firming market.
For example, the demand in the prestigious suburb of Hawthorn, with an average price of $1.4 million, was just as strong with 83.3 per cent of properties being sold at auction.
Closely following was Balwyn North with a median house price of $1.35 million, an annual increase of 27 per cent. There has been major interest in the inner-north, attracting many developers and investors.
With the infrastructure surrounding the universities, these areas are becoming a hot spot for the student market and young renters. Northcote, for example, is evidence of this trend, with 38 per cent of people living in the suburb aged between 20 and 39.
Over the past five years, Melbourne has experienced total value growth of 28 per cent, according to RP Data.
Australian Bureau of Statistics preliminary estimates show the price index for residential properties for the weighted average of the eight capital cities rose 1.5 per cent in the September quarter 2014 and the index rose 9.1 per cent through the year to the September quarter.
The capital city residential property price indexes rose in Sydney (2.7 per cent), Melbourne (1.0 per cent), Brisbane (1.0 per cent), Adelaide (1.0 per cent), Hobart (1.0 per cent), Canberra (0.3 per cent) and Darwin (0.3 per cent), and fell in Perth (0.1 per cent).
Annually, residential property prices rose in Sydney (14.6 per cent), Melbourne (6.9 per cent), Brisbane (6.7 per cent), Adelaide (5.6 per cent), Hobart (4.3 per cent), Perth (3.7 per cent), Darwin (3.4 per cent) and Canberra (2.4 per cent).
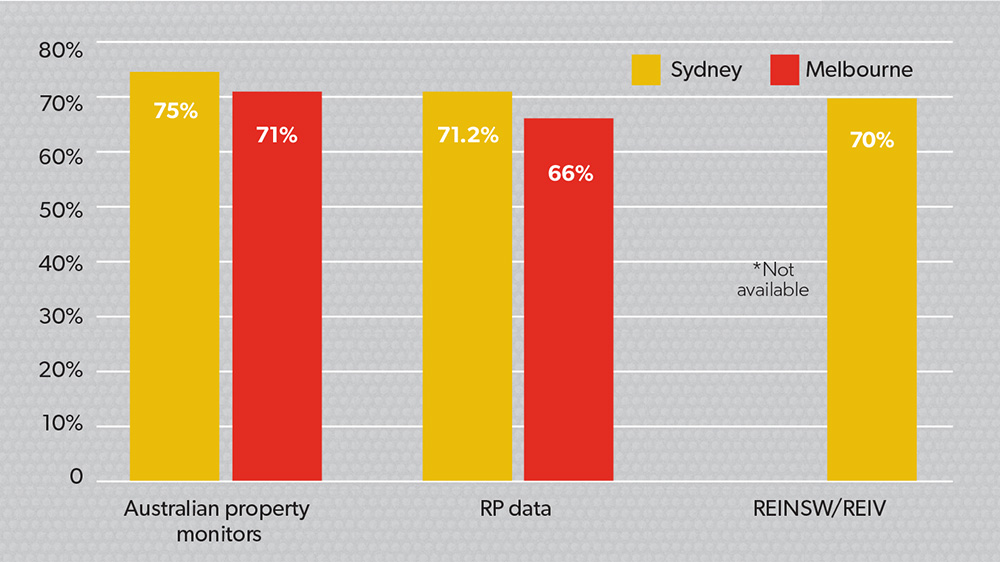
Auction clearance rates
In Sydney, a preliminary clearance rate of 71.2 per cent was recorded in the week ending 13 December, compared to 66.1 per cent in the week ending 6 December 2014, and 72.2 per cent the same week in 2013. The Sydney auction market had delivered good outcomes for sellers, with a higher clearance rate and number of sales.
The clearance rate for 2014 was likely to be close to 74.4 per cent, according to RP Data, higher than 2013’s 72.7 per cent.
A clearance rate of 70 per cent was recorded by REIV across Melbourne for the week ending 13 December 2014, compared to 66 per cent the weekend before and 68 per cent for the same weekend the previous year.
There were 1266 auctions reported to the REIV, with 881 selling and 385 being passed in, 192 of those on a vendor bid.
The inner-Melbourne region had the highest clearance rate to that date, resulting in a high 73 per cent, and the top auction suburbs were Reservoir, Richmond, South Yarra and St Kilda, with over 450 auctions held in each suburb.
Chart 1: Property auction clearance rates (week ending 13 December)
Capital cities
A preliminary weighted average clearance rate of 65.2 per cent, according to RP Data, was recorded the week ending 13 December 2014 across capital cities, compared to 63.7 per cent the previous week and 65.1 per cent at the same time in 2013.
The market had shown signs of cooling off since late spring, but this hadn’t prevented the overall clearance rate for 2014 exceeding 2013’s result. In 2013, the capital cities clearance rate was 66.2 per cent and with one week to go last year it was 67.9 per cent.
With the exception of Melbourne and Perth, the clearance rate had risen in each capital city.