


Nick Shugg introduces more relevant performance tables to assess how SMSF investment portfolios are tracking.
SMSF trustees have a problem in obtaining proper comparative data to benchmark their fund performance and this creates a large opportunity for advisers looking to form relationships with self-directed trustees and create new revenue streams.
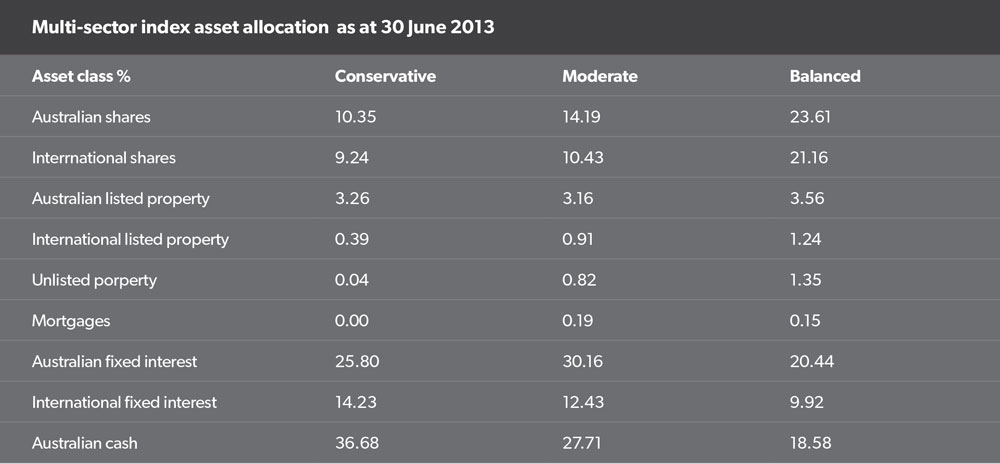
One of the problems with existing benchmarking information for SMSF trustees is that performance reports may just use one or two indexes, which does not consider the total fund performance.
Alternatively, the reports may use model portfolios with asset allocations more typical of how larger Australian Prudential Regulation Authority-regulated funds are investing as opposed to SMSFs.
Although advised SMSFs may have more diversity, there are some 400,000 self-directed SMSFs, and ATO data shows not many of those have 21 per cent in international shares as in the balanced option in Table 1.
In his paper, “Who starts a Self-Managed Super Fund and why?”, Professor Ron Bird found that although one of the reasons people choose to run their own super fund is the desire for greater returns, many trustees have no idea how their fund is actually performing. He called this the “information gap”.
The implication of this can be significant for a trustee as they cannot obtain affirmation that their current approach is going well or an early warning that some action could be taken to keep on track.
Benchmark portfolios for SMSFs
At SMSF Benchmarks we have designed a series of 11 benchmark portfolios specifically for SMSFs, based on how they are typically investing, according to ATO data, and referencing a PhD by Dr Adrian Raftery.Nine of the benchmark portfolios are broadly based on deciles of growth assets to cater for differing risk profiles and two of the portfolios cater for SMSFs investing in direct property.
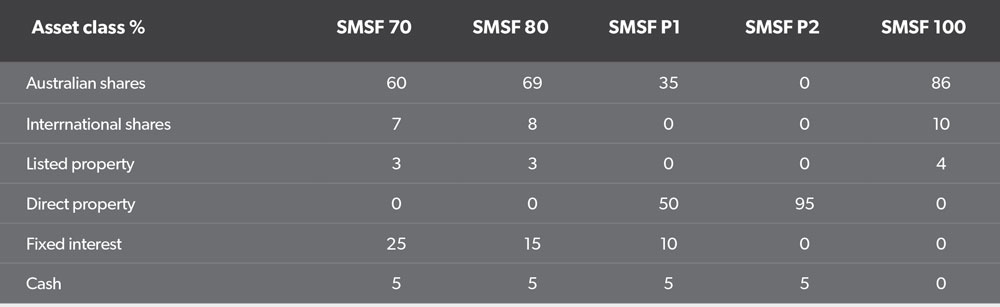
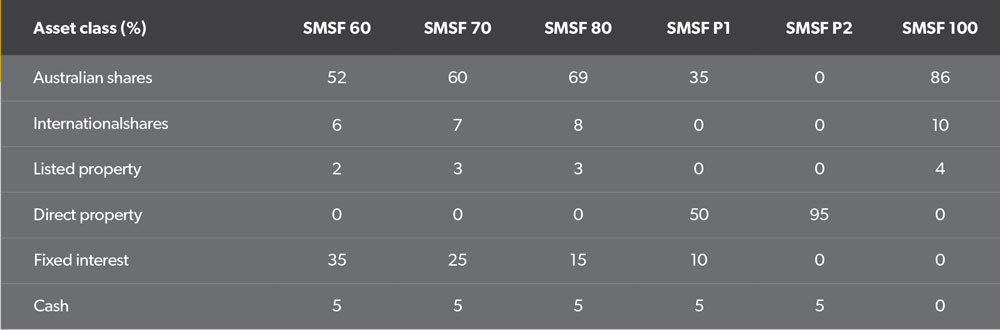
Table 2 shows the asset allocation for a selection of the benchmark portfolios. SMSF 70 is for SMSFs with 70 per cent growth assets/30 per cent defensive. SMSF P1 is a benchmark portfolio that includes direct property as part of a diversified portfolio and SMSF P2 is for funds that are almost exclusively investing in direct property.
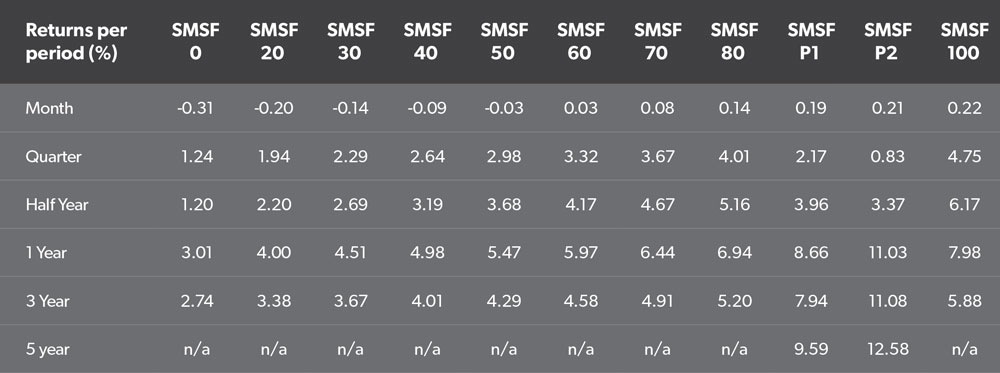
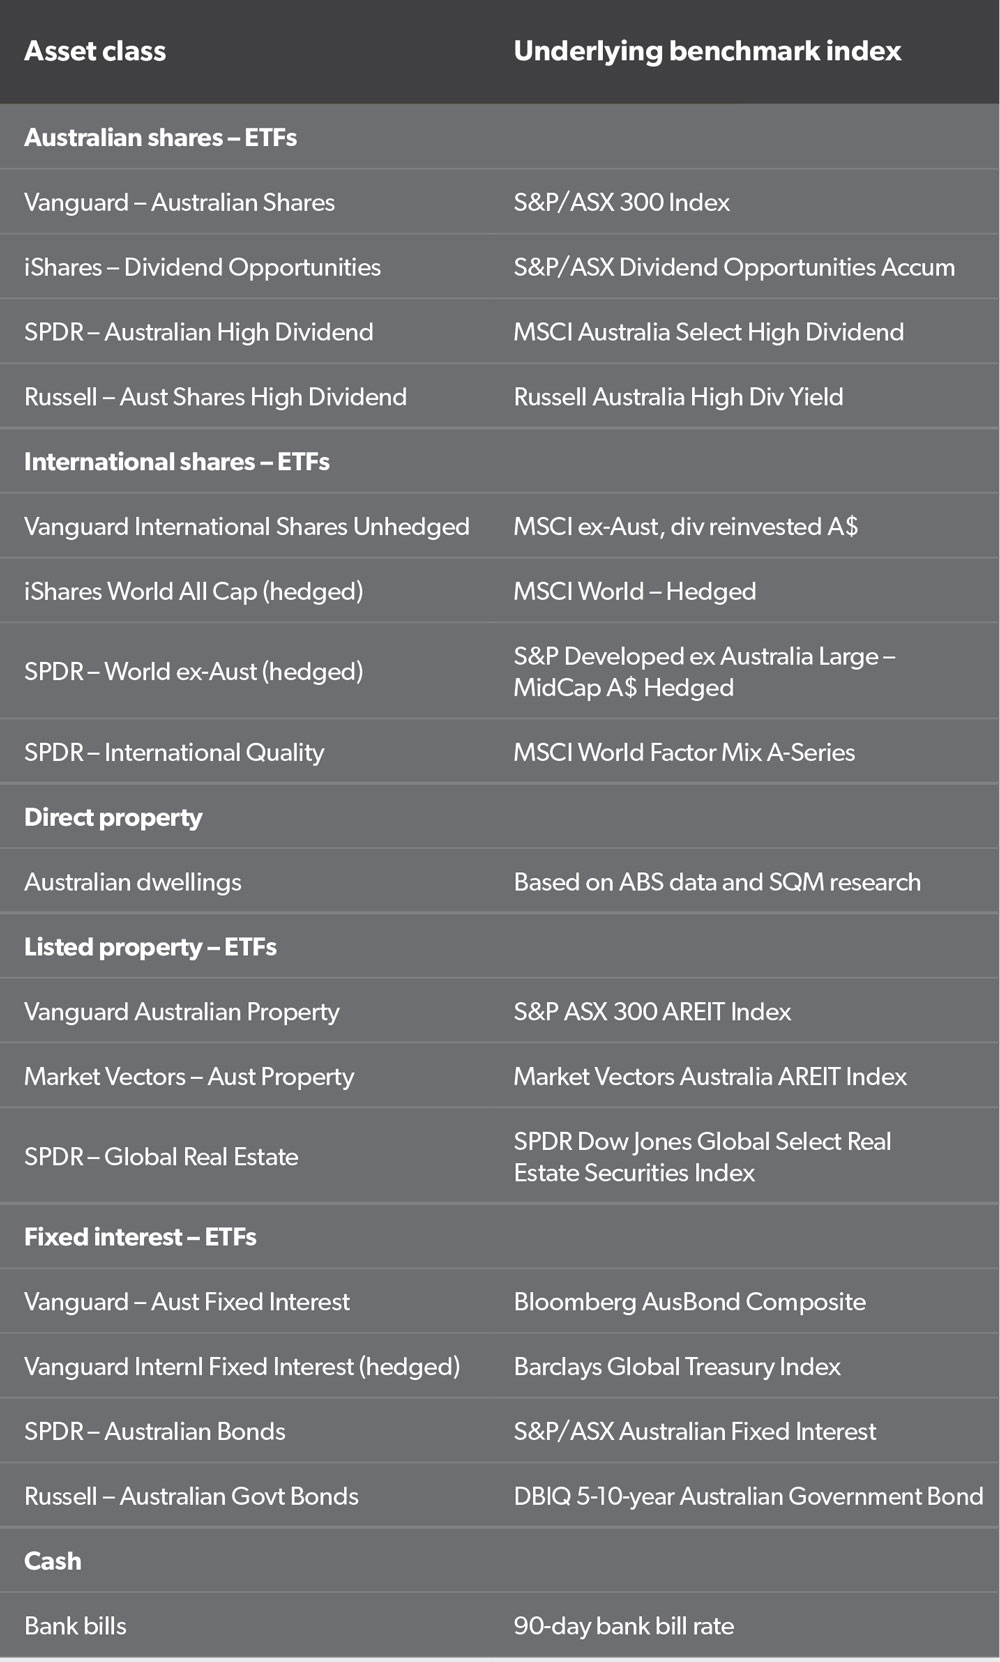
Each month we calculate the returns of the SMSF benchmark portfolios using a ‘basket’ of exchange-traded funds (ETF) in each sector. For Australian shares we have a tilt towards high-yield ETFs because that’s the way many SMSF trustees are investing.
Direct property returns are based on Australian Bureau of Statistics data and SQM research, and we apply the geographical split of SMSFs across each state, based on ATO statistical reports.
We have a white paper in our knowledge centre about how we designed the SMSF benchmark portfolios, for those interested in further details.
How can the SMSF benchmark portfolios be used?
- Firstly, the SMSF benchmark portfolios are not designed to tell trustees how they should be investing; they are based on how trustees are actually investing according to ATO statistical data.
- The SMSF community can use them to get an early estimation of the returns each of the 11 groups of SMSFs may have experienced over various periods.
- Trustees can use them to get a better idea of how their fund has performed, depending on which benchmark portfolio has the most similar asset allocation to their fund.
- Advisers can use them to have new conversations with prospective self-directed SMSFs.
In my experience, there is a low referral rate of self-directed SMSFs from accountants to advisers, even where the adviser is in-house. The main reason for this seems to be that while many SMSF trustees have set up their fund for reasons of control, many advisers still go into meetings focused on winning funds under management (FUM). This often causes scepticism and mistrust.
I strongly believe advisers who are prepared to work with self-directed trustees and assist them to remain self-directed will be very successful.
Advisers can provide a new service for a reasonable fee and their service should include regular benchmarking.
This should be a potentially exciting new revenue stream, even if the adviser never wins the FUM.
Importantly, it allows the adviser to get started with the relationship and over time demonstrate their real value, which is in other areas such as cash-flow modelling and life planning.
It is also likely some of the clients will realise they are not going as well as they thought they were and engage the adviser for their full advice service along the way.