SMSF investors have a habit of favouring allocations to large companies that can be considered household names. However, Louis Crous argues individuals should consider the inclusion of smaller-cap company shares in portfolios to improve overall returns.
When it comes to portfolio construction, having an effective asset allocation in place should be the first priority for all investors. Most importantly, this asset allocation process should address the investor’s preference for investment risk and return. It is only after establishing these parameters that investors should focus on the merits of each investment that makes up an asset class. This article focuses on the equities component of the allocation and, in particular, the Australian equities allocation.
Very few investors have the requisite skills and experience to invest directly in a portfolio of shares that will outperform the broad market over time. With this in mind, investors may be better off investing with one or more quality active managers or simply in a low-cost passive solution.
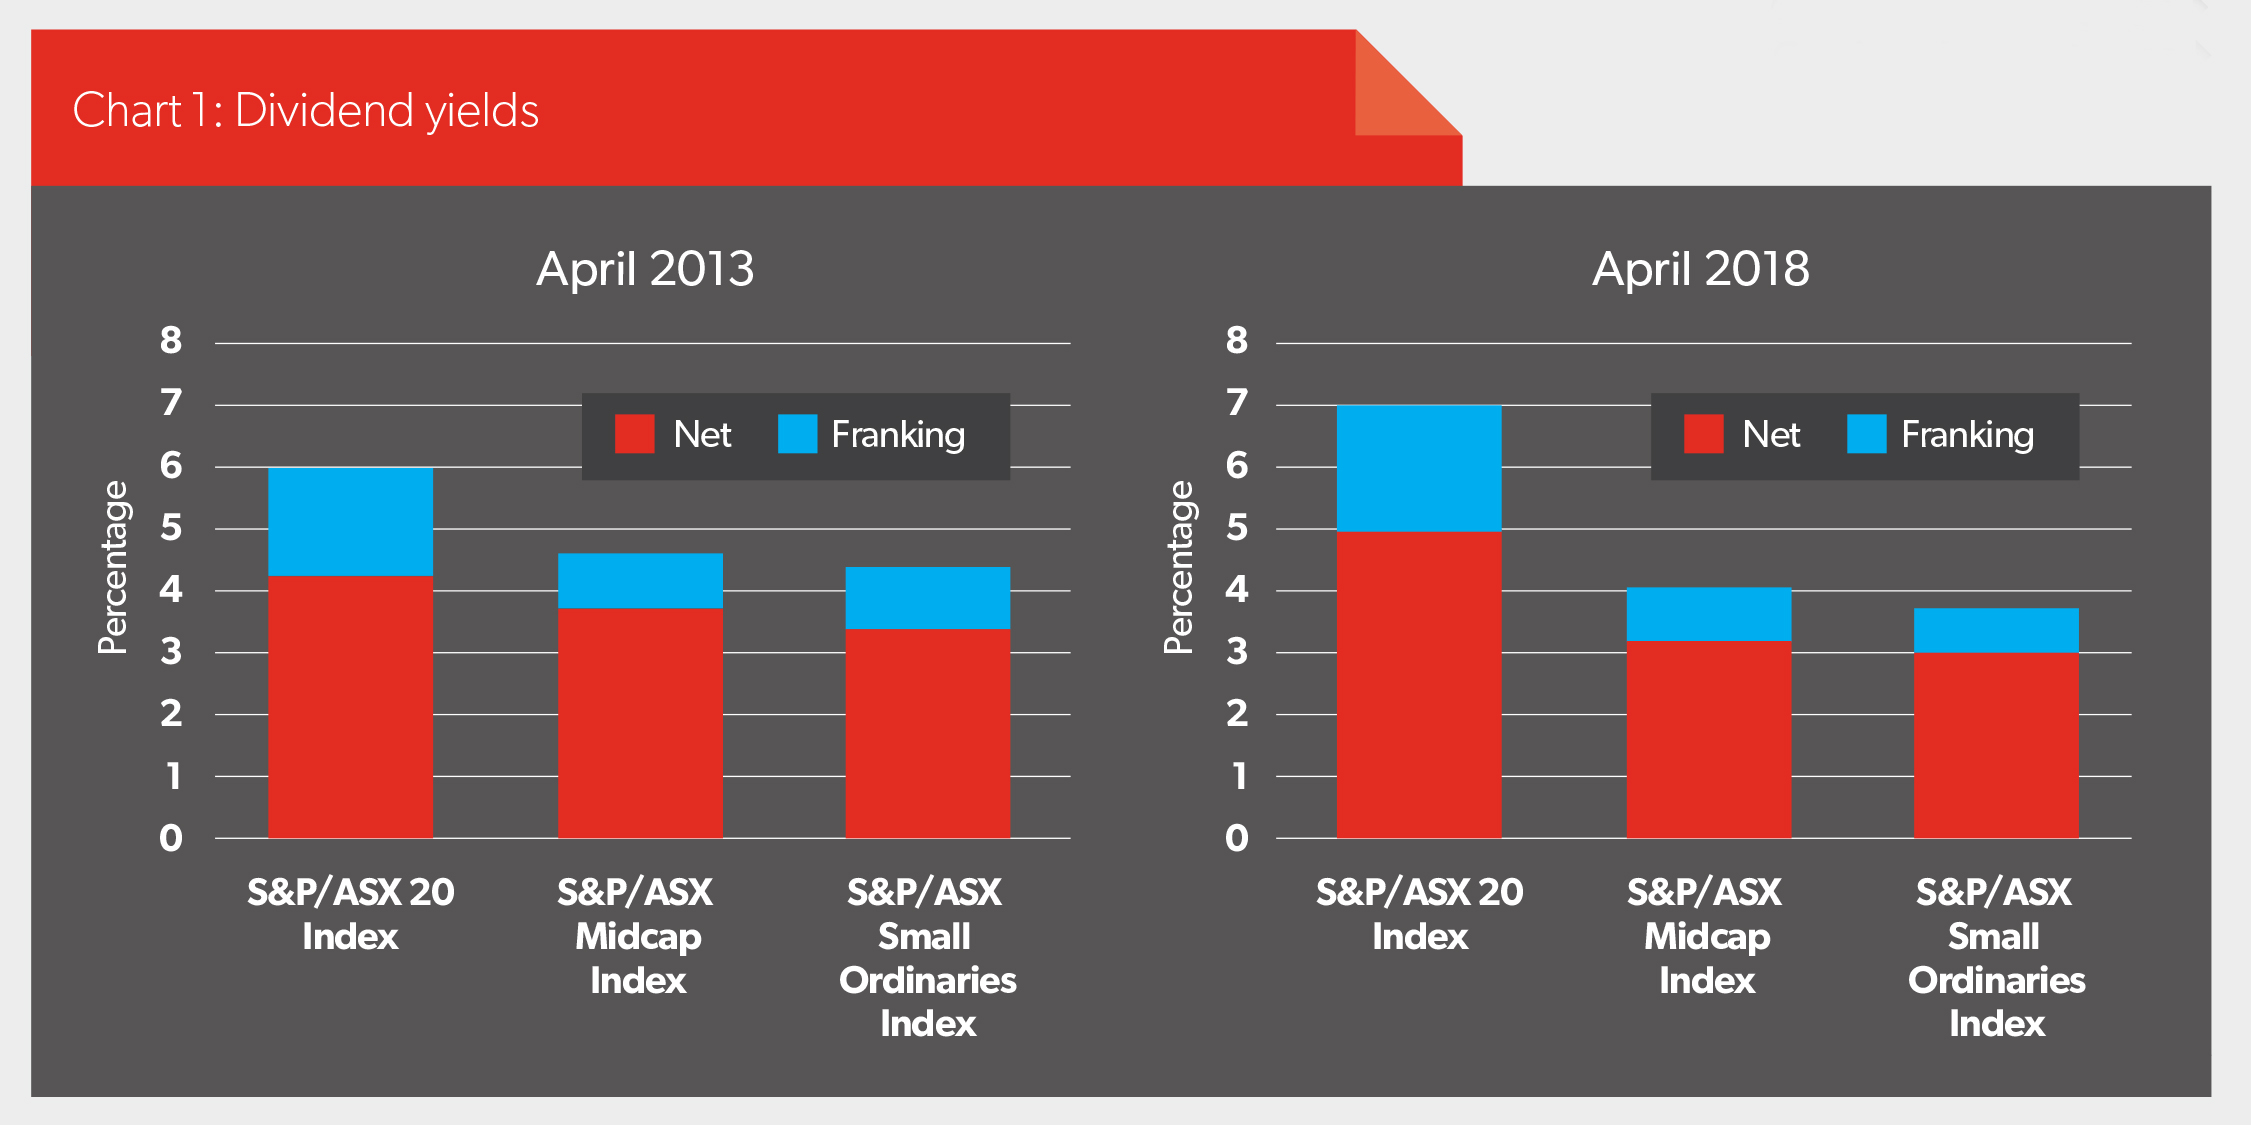
However, the fact remains many investors still invest directly and do so in a relatively concentrated manner. Due to a variety of factors, these investments tend to also consist of the largest Australian shares by market capitalisation, also known as blue-chip shares. Familiarity of brand names, a notion of bigger is better and the attraction of high dividends are all reasons for this investment preference. The strong dividend and franking credit profile of these large-cap stocks in particular resonated with investors over the past few years as interest rates reached historic lows. Moreover, the stubbornly anemic global economic growth further added to the appeal of higher-yielding assets.

Chart 1 illustrates the stronger dividend profile of the largest Australian companies by market capitalisation and the increase of this yield over the past five years.

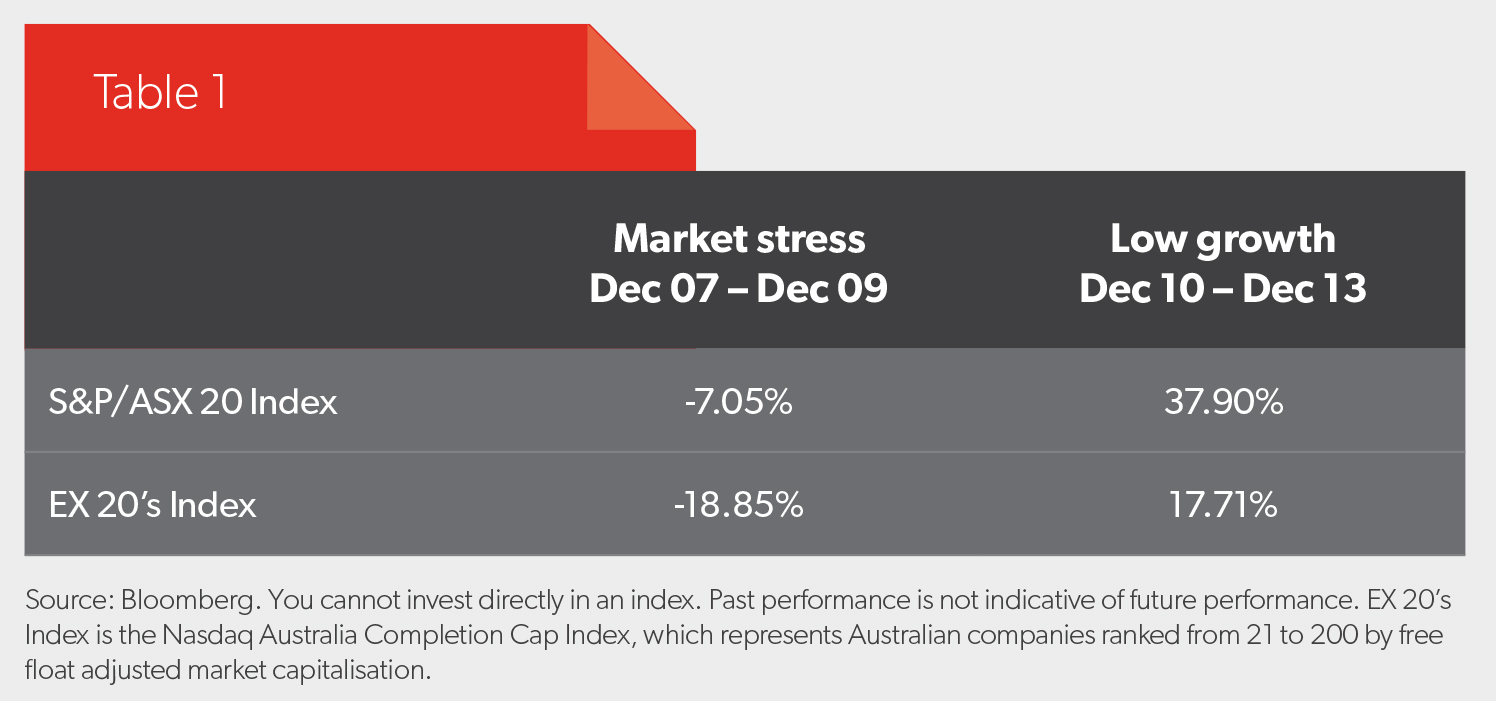
Buying stocks with strong cash flows and dividend payout ratios can lead to superior relative performance during times of market stress or low-growth environments. During such conditions, investors turn defensive and generally rotate into these stocks and out of more speculative exposures. In recent periods, this occurred during the global financial crisis sell-off and the subsequent period of global austerity measures (see Table 1).

"The good news is within the Australian market there are segments offering exposure to different growth profiles than those available from the largest 20 stocks."
Louis Crous
Investing for the long run
Attractive current dividend yields, however, only paint half the picture when investing for the long term and in certain instances can lead to value-trap investing. Value traps occur when stocks appear to be cheap by metrics such as high dividend yields, only to fall further in price due to continuing deterioration in business performance. In these cases the attractive yields merely served as a siren song.
In order to accumulate wealth, investors must also continually assess whether the companies they invest in have the ability to grow earnings. This is certainly no easy task. For many of the Australian blue-chip companies their businesses are now fairly mature and few have any successful international expansion as part of their current growth strategy. As a result, they compete fiercely for local market share where total revenue pools are limited. Telstra is a very good example of such a business. As the largest telecommunications company, Telstra has been in an enviable position historically and many investors were drawn to this profile and the strong dividends it paid out every year. However, fierce competition from smaller players in newly rolled out technology, coupled with challenging regulatory reforms, has significantly altered the company’s growth profile and even the ability to maintain dividend levels. The end result has been very disappointing long-term returns for shareholders. Telstra is, of course, one example, but similar questions regarding future growth potential can be asked about other large Australian companies, including the big four banks.
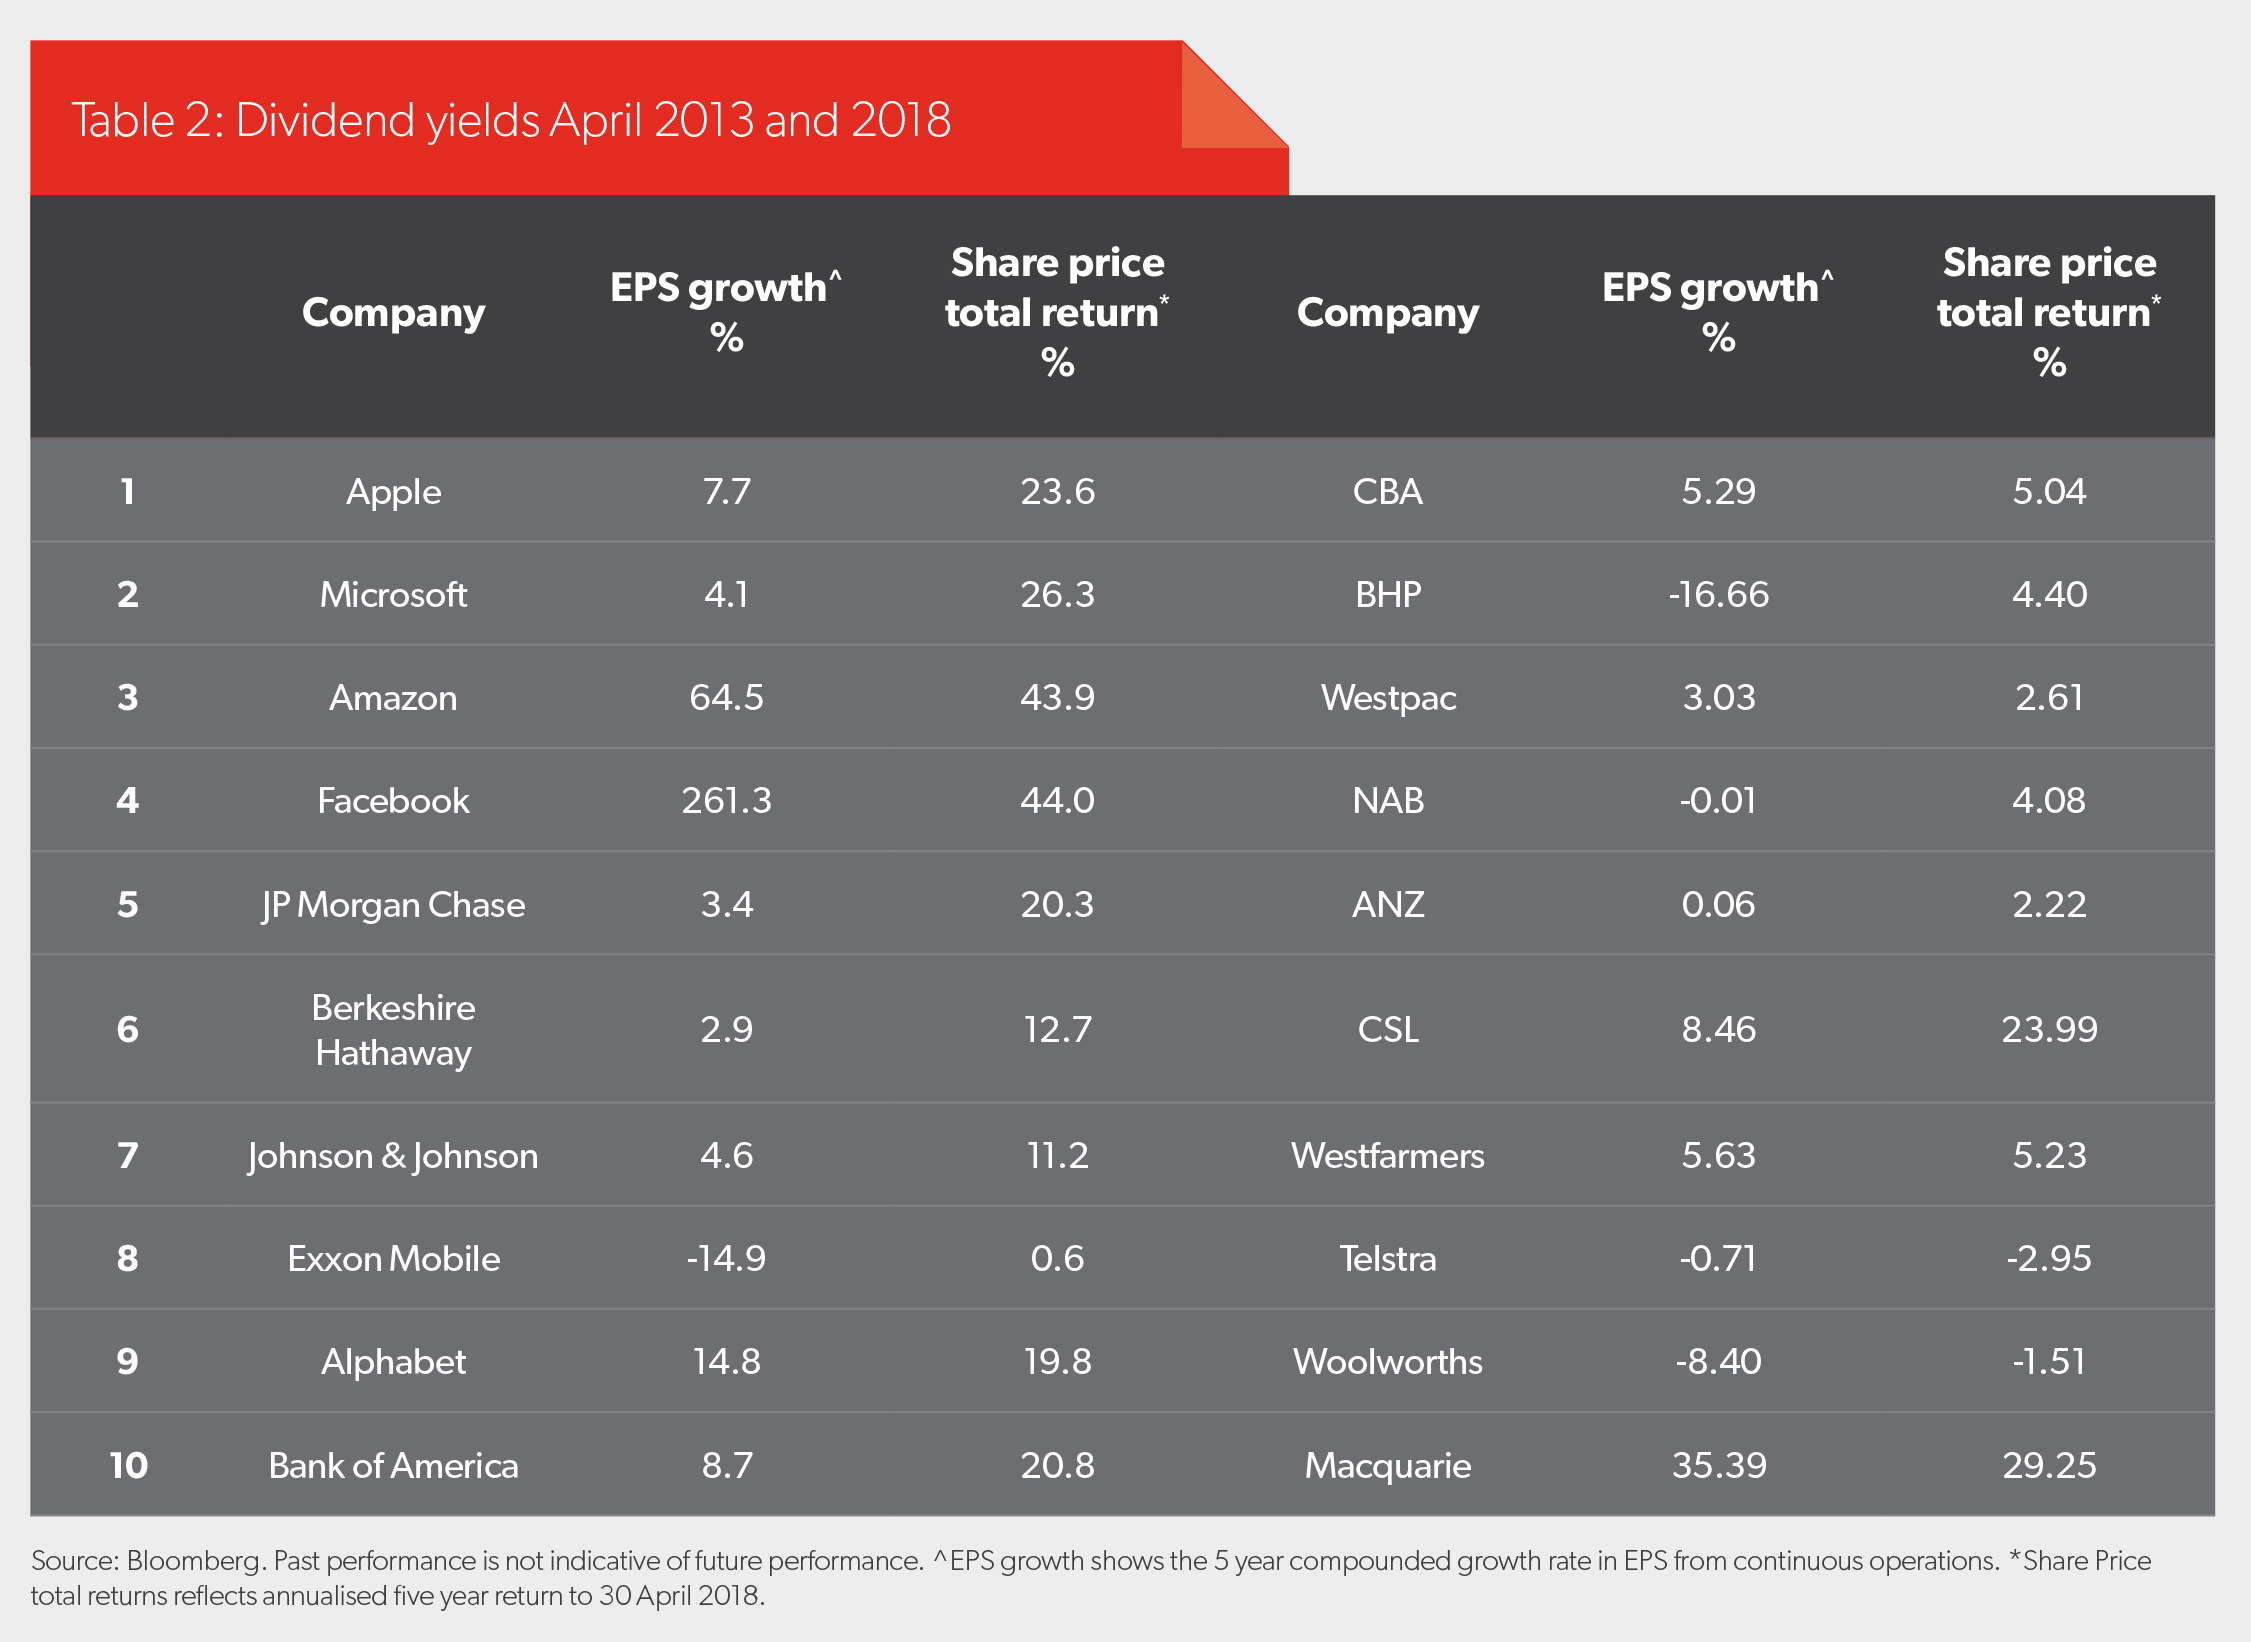
Contrast this, for example, to the United States, where the top 10 largest companies have quite different growth profiles (see Table 2).

Not only do the largest US companies show better average shareholder and earnings per share growth, but more disconcerting is the fact many of the Australian companies actually delivered negative price growth after adjusting for their dividends. And this during a time when the equities market is still in a bull market phase.
The X factor: looking outside the top 20
The good news is within the Australian market there are segments offering exposure to different growth profiles than those available from the largest 20 stocks. While this growth will shift across industries and individual companies over time, investors may be interested to know a simple passive investment outside the largest 20 stocks offers a compelling case. The Nasdaq Australia Completion Cap Index is an index that represents the companies ranked from number 21 to 200 by market capitalisation and this exposure is easily accessible via the BetaShares Australian Ex-20 Portfolio Diversifier ETF (EX20), which aims to track this index. The underlying stock holdings within this exchange-traded fund are more evenly diversified across industry sectors than the broad market S&P/ASX 200 Index, which is still heavily influenced by the profile of the top 20 stocks (the constituents of the S&P/ASX 20 Index make up about 58 per cent of the S&P/ASX 200 Index).

"The good news is within the Australian market there are segments offering exposure to different growth profiles than those available from the largest 20 stocks."
Louis Crous
Long-term return, risk and earnings growth benefits
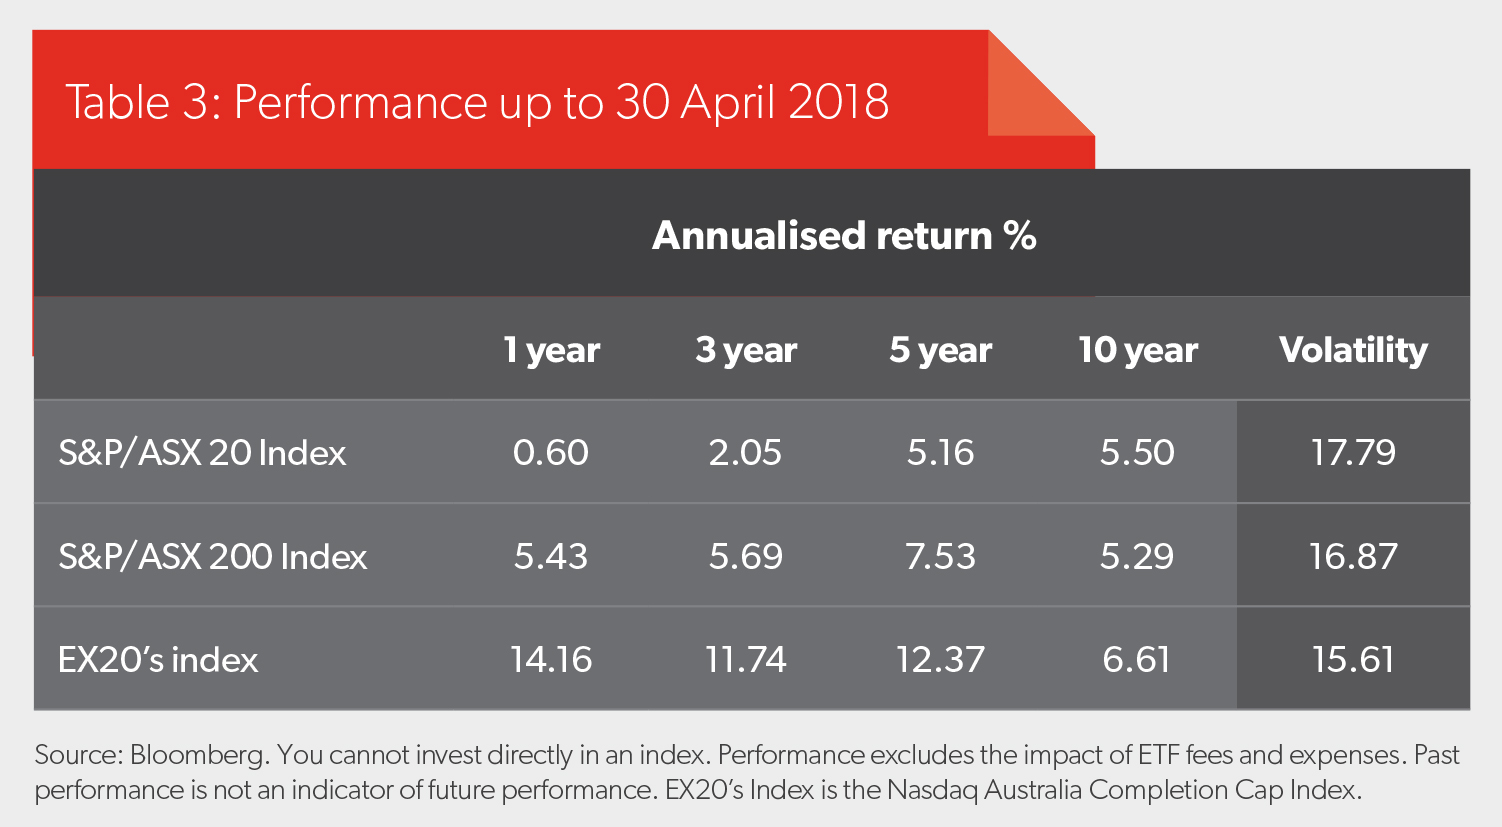
Despite the outperformance of the large caps during the GFC and subsequent period (table 1), the Nasdaq Australia Completion Cap Index outperformed the S&P/ASX 200 Index over the 10-year period, including the GFC and up to 30 April 2018 (6.61 per cent versus 5.29 per cent annualised). The outperformance was particularly impressive over the past three years when global market sentiment improved substantially – a common environment for mid and small-cap stocks to outperform (11.74 per cent versus 5.69 per cent annualised). Over this period, coincidently, the S&P/ASX 20 Index could only deliver a 2.05 per cent annualised total return.
An often overlooked feature of mid and small-cap stocks is the lower volatility they exhibit. Investors may have mistakenly thought these stocks may have exhibited higher volatility due to their smaller size, lower liquidity, or less stable or diversified earnings. The reality is stocks within this segment of the market are more diversified across sector industries and also show lower correlation to one another than large caps (see Table 3).
And what about the future? Earnings growth forecasts for the Australian market still favour the mid and small-cap segment. According to Bloomberg, on a one-year forward-looking basis, stocks within the S&P/ASX 20 Index are only expected to grow earnings by 3.35 per cent, while stocks in EX20 are expected to grow earnings by 11.31 per cent. These types of growth rates can have a meaningful impact on the ultimate equity risk premium.

How investors can use EX20
Market exposure: EX20 is a diversified portfolio with superior historical long-term risk-adjusted returns and may therefore be preferred by investors as their core Australian equity market exposure.
Portfolio diversification: Investors who feel they have too much exposure to the largest capitalisation stocks (and their associated higher sector concentration), can easily add EX20 as a portfolio diversifier and conveniently obtain an exposure closer to the broad Australian equities market.
Economic growth tilts: Mid and small-cap stocks generally offer opportunity for attractive relative returns during stronger economic growth periods. These companies earn the largest portion of their revenues domestically and are therefore more leveraged to the business cycle. Historically, they have also outperformed the broader market in periods of rising interest rates. Our view is Australia currently lags the US market from a recovery point of view. This is reflected not only in the trend of economic indicators, but also stock market performance. We expect Australia’s economic growth to continue given the global economic backdrop, and we would look for stocks, as represented by EX20, to therefore outperform the broader market.
It is our view that a diversified Australian equity allocation to the section of the stock market that excludes the largest market capitalisation stocks is worthy of consideration by investors. We believe such an exposure offers potential for compelling investment outcomes for a variety of strategies and, ultimately, long-term equity returns.


