

Asset allocation and the selection of which managed fund to use can be two of the most important factors in maximising investment returns, writes Stuart Fechner.
The typical investment or superannuation portfolio is of a diversified nature, that is, the portfolio contains a mix of exposures across different asset classes, such as shares, bonds, property and cash, including both Australian and global offerings.
To ensure a portfolio is suitable for an investor’s risk profile and individual goals and objectives, it’s important to align an appropriate mix of those assets. This effectively determines descriptions of investor types, such as conservative, balanced, growth and high growth.
Asset allocation is king – isn’t it?
Many studies have been conducted to determine what portion of a portfolio’s return is driven by asset allocation and it’s generally agreed the figure is around 90 per cent. Vanguard’s “Principles for Investing Success” white paper says: “This has been well documented in theory and in practice. For example, in a paper confirming the seminal 1986 study by Brinson, Hood and Beebower, Scott et al (2016) showed the asset allocation decision was responsible for 89 per cent of a diversified portfolio’s return patterns over time”.
Let’s clarify something before we take this information at face value.
Investor types – such as balanced and growth – reflect an investor’s ‘risk profile’ in the primary instance, but also to a strong extent their likely return outcome.
This is because risk and return aren’t independent of each other, but in fact closely linked. It’s a generally accepted rule that the higher the risk, the higher the expected return (over an appropriate investment time frame for each given asset class).
Risk and return assumptions are essential in selecting an appropriate asset allocation for any investors. I believe many within the industry have become over-engaged with the notion of asset allocation explaining circa 90 per cent of returns at the expense of little reference to the associated explanation of risk or volatility.
Don’t miss the point in the above study of asset allocation being responsible for 89 per cent of the return patterns over time. That is, it explains how the returns are achieved and not just the level of return. In fact, it’s the pattern of returns that effectively represents the risk or volatility of how the given returns are achieved.
Drilling into the detail
In my experience in the investment industry there is a far greater percentage of time, effort and research spent on investment funds than on the overarching asset classes.
To me, this underlying level of diversification in a portfolio – that is, having a range of investment funds within an asset class – is equally as important as the asset class exposure itself.
As the number, and more importantly the range and varying type, of funds has steadily grown over time, so too I believe has the importance of fund selection in constructing a portfolio.
The data in table 1 explores this in further detail, firstly by assessing the differences in return outcomes between asset classes, and then between different funds within each asset class.
The variance in returns between the best and worst-performing asset class across each of the different time frames (see the bottom row of the table) is quite significant, illustrating how the asset class decision is a significant factor in driving the return outcome.
Table Table 1: Asset class returns to 30 November 2018
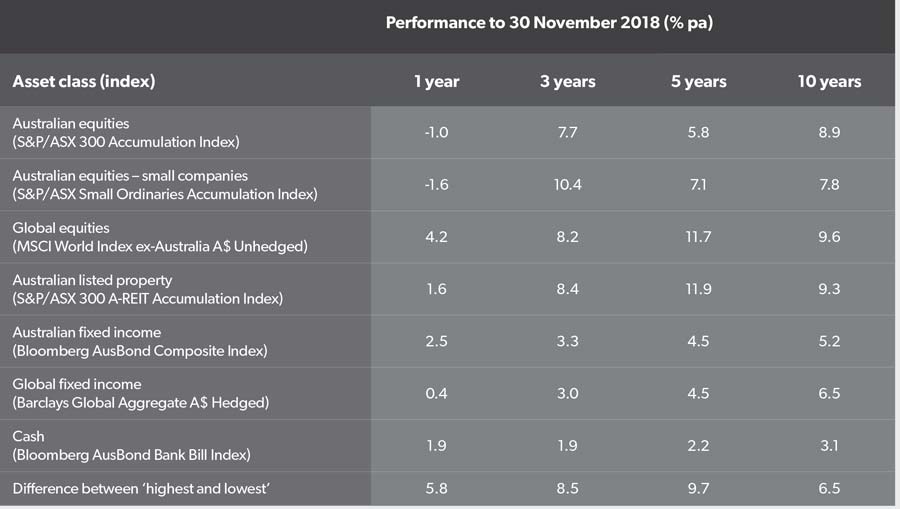
Source: Zenith Investment Partners – Fund Survey Reports. Returns to 30 November 2018.
It is somewhat surprising, however, that the smallest difference in asset class returns is across the shortest time frame of one year. Typically the greatest variances occur over the shorter periods.
This can be explained, however, by the somewhat muted nature of returns across all asset classes for the 2018 calendar year, levels that are clearly lower than longer-term averages. To highlight the swings in growth asset class returns that can and do occur over shorter-term time frames, table 2 shows the related equity market (and cash) index returns over one year at the end of September 2018.
In this instance, the difference between the best and worst-performing asset class is a significantly higher 18.9 per cent. This further highlights the volatility of short-term returns, and why longer-term return expectations should be used when assessing and determining an appropriate asset allocation mix within a portfolio.
Looking back to table 1, the largest spread between the best and worst-performing asset classes was recorded over the five-year period – the longest time frame. This difference of 9.7 per cent would make an impactful difference to the overall return of any investment portfolio.
It’s also worth assessing the difference in returns between asset classes within the overarching categories of ‘growth’ and ‘income/defensive’.
Across all time frames, the best performance came from those asset classes classified as ‘growth’ – shares and property. The lowest return in each time period was recorded by a sector classified as ‘income’ or ‘defensive’ – fixed income or cash.
So another key asset allocation decision is the allocation between growth and income/defensive assets.
Looking at the returns between the ‘growth’ and ‘income/defensive’ asset classes over the five-year time frame, a more narrow spread is evident. Within the ‘growth’ category, the difference between the highest and lowest-performing asset classes is 6.1 per cent (note it’s significantly less over 10 years at 1.8 per cent). Within the ‘income/defensive’ category, the difference is 2.3 per cent.
Table 2: Asset class returns over one year to 30 September 2018
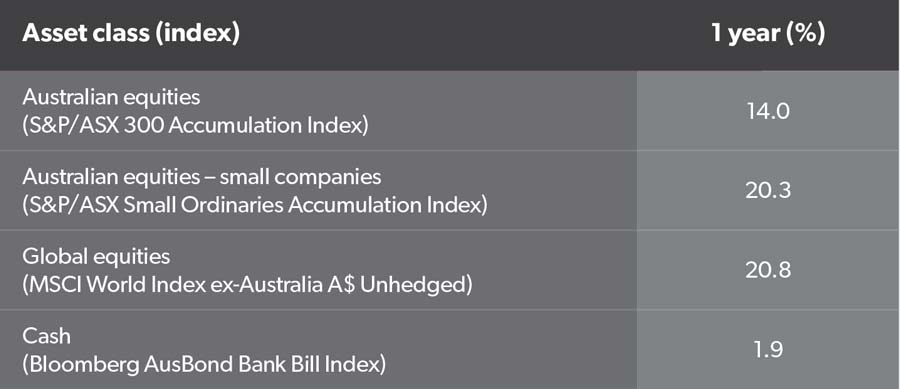
Source: Zenith Investment Partners – Fund Survey Reports. Returns to 30 September 2018.
Although there is a notable difference within the ‘growth’ asset class category, it’s not as significant as the typically larger difference between the broader ‘growth’ and ‘income/defensive’ categorised investments.
The all-important fund selection
In terms of building a robust and well-diversified portfolio, on top of determining the appropriate asset allocation mix there are further key decisions that need to be made – fund selection.
Similar to the above, to what extent does the return between the best and worst-performing managed fund within each asset class differ? And how does this compare in size and importance to the differences noted between asset classes? As this data shows in table 3, there is a stark difference.
Within the equities categories, the difference between the best and worst-performing funds is significantly larger than the difference seen between the best and worst-performing asset classes.
The fund selection process is therefore important in determining the outcome of any diversified portfolio, increasingly so as the exposure to equities increases.
Table 3: Fund performance to 30 November 2018 (%)
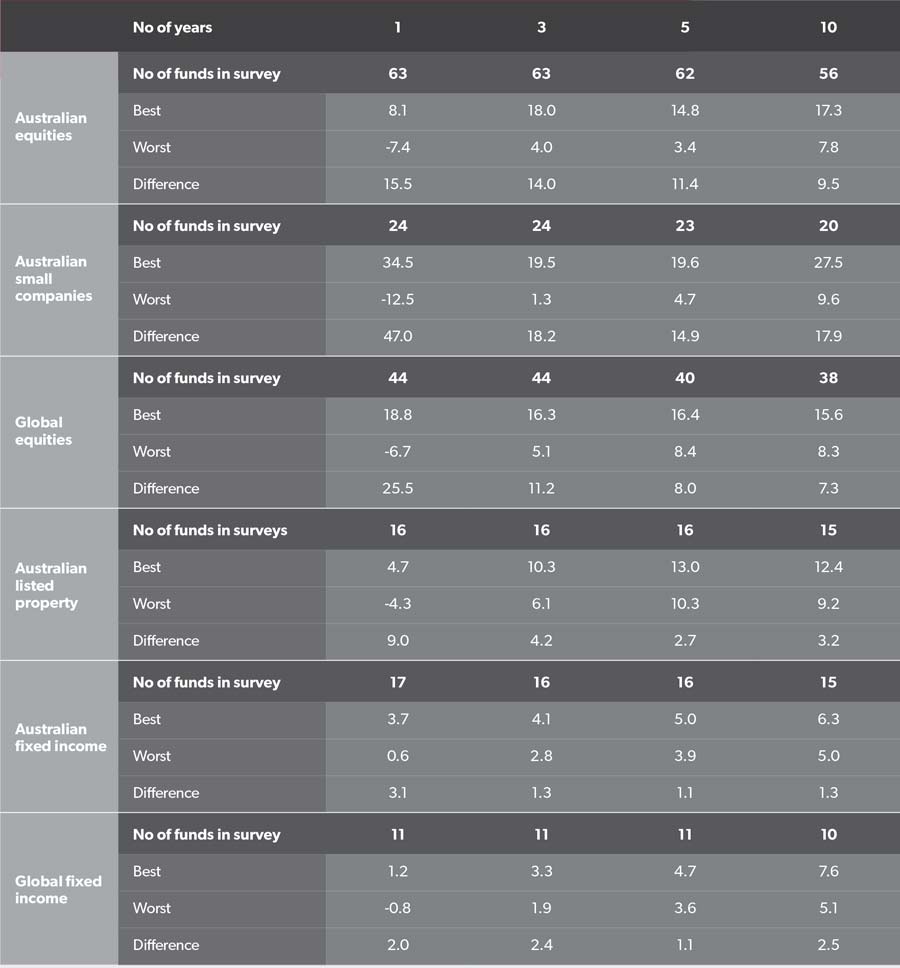
Source: Morningstar Australian Institutional Sector Survey, December 2018. Returns to 30 November 2018.
With the commonly accepted notion of asset allocation driving around 90 per cent of a diversified fund’s performance (pattern) and given the large difference between equity fund returns, what is the relative importance of the fund selection decision?
There’s no exact science in determining an answer to this question, but consider the following scenario: imagine two portfolios that have a 30 per cent difference in allocation between Australian equities and cash, fairly typical of a standard balanced/balanced growth portfolio.
Using the figures from table 1, the difference in returns between those two asset classes over the three-year period is 5.8 per cent (Australian equities 7.7 per cent and cash 1.9 per cent). Thirty per cent of 5.8 per cent equates to a difference in performance of 1.74 per cent yearly over the three-year period.
A robustly structured diversified portfolio would also diversify across different funds within each asset class. So let’s say the 30 per cent Australian equities exposure is equally shared across four different funds, equating to each fund representing 7.5 per cent of the overall portfolio.
Over the same three-year period, according to table 3, the difference between the best and worst-performing Australian equity funds is 14 per cent. Around 7.5 per cent of 14 per cent equates to a difference in performance of 1.125 per cent yearly over the three-year period. This is around two-thirds of the difference calculated when referencing the variation in exposure to the best and worst-performing asset class, which is not an insignificant amount.
But wait, there’s more
The pattern of returns, not simply the return itself, plays an increasingly important role as investors progress through the accumulation phase and into the retirement/drawdown phase of their investment life cycle.
This might mean an increased consistency in how returns are achieved, minimising or reducing downside risk or negative returns, or perhaps having an increased portion of the overall return being in the form of income as opposed to growth.
In this case it’s also important to identify and align ‘a fund for a purpose’. This means understanding not only the type of assets the managed fund invests in, but also its structure and the possible characteristics of the likely returns, not only in the good times, but also in more challenging periods when returns may be negative.
Licensed financial planners need to operate in accordance with certain standards put in place by the corporate regulator. Any self-directed investor should also look to incorporate these standards into their investment processes.
An adviser must undertake reasonable investigation into the client’s relevant personal circumstances and the subject matter of the advice, and base the advice on those investigations. These requirements, the ‘know your client’ and ‘know your product’ rules, are also known as the ‘suitability’ rule.
The suitability rule outlines that when making a recommendation, the advice provider must have reasonable grounds the recommendation is suitable for a customer based on their financial situation and needs. It goes without saying that any self-directed investor should apply this same approach.
However, the complexity of investment language and terminology, along with the broad array of differing investment funds can make this challenging for investors.
This has not been lost on the industry. There is a bill waiting to be presented to Parliament that will introduce customer-targeted and principles-based product design for financial products, plus more stringent distribution obligations to overcome lack of consumer understanding because of inadequate disclosure, poor product design and poor financial literacy.
Within the self-directed segment of the wealth industry this highlights both the challenges and importance of managed fund selection within the investment process. Asset allocation may be trumpeted as the driver of return outcomes, but the importance of fund manager selection is surely running a close second.