

Nick Shugg provides the latest SMSF tables to assess how well client investment portfolios are performing and analyses the strongest asset classes currently.
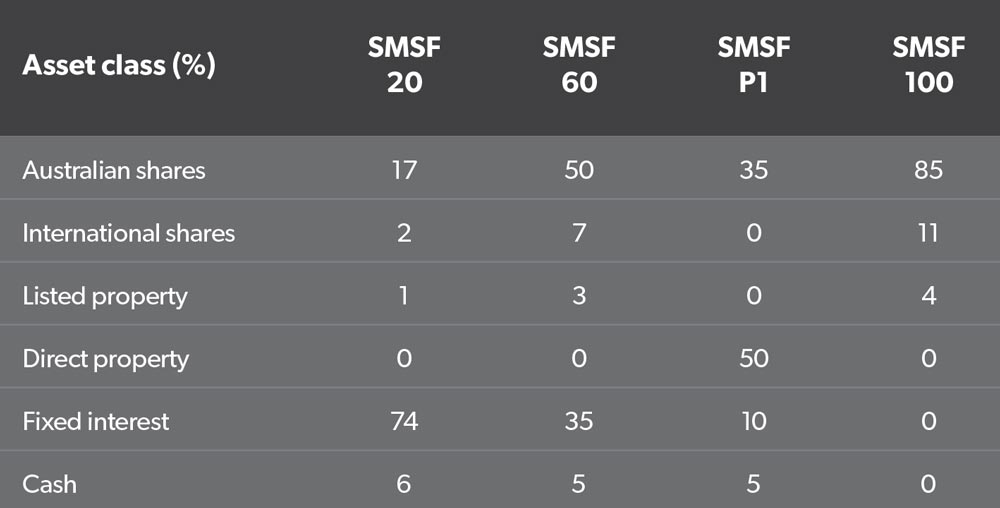
SMSF Benchmarks’ SMSF 60 Benchmark Portfolio is based on how the average SMSF trustee, who has a risk profile of 60 per cent growth/40 per cent defensive assets, is investing.
Over the three years to 30 September 2018, this moderate risk investor achieved a similar average return to SMSFs that have directly owned property in the fund as part of a diversified mix (SMSF P1), and they have significantly outperformed over the past year.
Graph 1 shows the rolling one-year return from direct residential property around Australia (grossed up for rental income), and the 90-day bank bill rate (multiplied by 10 for scale). The one-year return has now fallen into negative territory as interest rates begin to rise.
What’s hot
The broad international share market continues to deliver high returns, up 9.38 per cent over the past six months (hedged). Is it overvalued? It possibly depends on whether the expected (forward-looking) earnings of businesses live up to market expectations
Using the forward price-earnings ratio as a guide, the long-term average is around a multiple of about 14. It is currently around 16, which could mean global shares are at the high end, somewhat overvalued, but nowhere near the 26 figure we experienced in 2000, which indicated significant overvalue. But there are certainly risks around. If forecast earnings disappoint, it means the ratio increases, which in my opinion, means the market is more overvalued.
Infrastructure
Many SMSFs have reportedly been moving money into infrastructure, perhaps looking for alternative solutions to yield, away from the banks.
Global infrastructure, which can be accessed on the Australian Securities Exchange these days, has delivered a return of 6 per cent over the past six months, but that figure is lower at 2.77 per cent for the full 12-month period.
What’s not
Gold is still the ‘biggest loser’ over the past quarter, half-year and 12-month period as the share market has been strong. However, international small-cap companies came off the most over the past month, perhaps because this sector is riskier than large-cap companies and people are reducing their exposure at this time in the cycle.
Australian financials continue to be hit as some major banks set aside large sums for possible compensation due to the revelations of the banking royal commission. Let’s say a bank had to pay out $300 million. Investor sentiment may lead to a short-term sell-off. But how does this sum compare to their annual profit? How much should this affect their long-term share price really? There could be good value around at some point.
Table 1
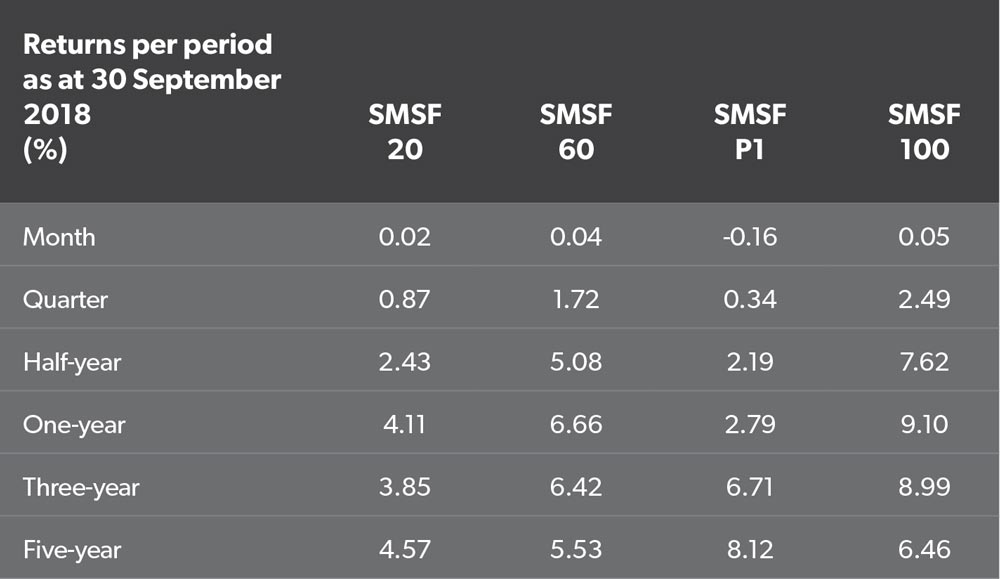
Table 2
Disclaimer: 1. These Benchmark Portfolios should not be taken as any form of advice. They are designed for information only. Speak to your professional adviser before taking any action. 2. While SMSF Benchmarks Pty Ltd has taken every care in the preparation of this information, the company, its directors and/or employees cannot be held responsible for any loss caused by action taken resulting from these benchmark portfolios. 3. Past Returns are no guarantee of future returns.