In part one of this two-part series, Steven Kempler analyses how allocations to infrastructure can strengthen portfolio performance, particularly when markets experience a downturn.
We believe investors seek to benefit from the essential service nature and strong strategic positions of infrastructure assets. Such investors also look for inflation protection and more stable income relative to certain other asset classes, such as global equities and global real estate investment trusts (REIT). The growing global interest in infrastructure has been supported by an historically lower volatility and a less-than-perfect correlation with global equities. We have previously analysed the role of infrastructure in a portfolio, including capital preservation, downside protection during market weakness, reduced correlations with other assets and a long-term inflation-linked growth in income. In this article, we review whether these attributes still hold true.
What are investors looking for in an infrastructure investment?
Generally, in our experience we have seen investors look to infrastructure assets to deliver lower cash-flow volatility and higher earnings stability compared with broader global equities. We have also seen investors target the asset class for its historically higher income, as well as the perceived inflation-linked growth of that income – both attributes with which we agree.
Infrastructure assets typically have strong strategic positions by being natural monopolies. These monopolies are the physical networks and structures that provide services essential to the basic functioning of society and its economic productivity. Ultimately, it is the commercial frameworks that underpin these assets that result in what we see as attractive investment characteristics.
What does the empirical evidence show?
To many asset allocators, infrastructure is often referred to as a ‘diversifier’ in a portfolio. The cash flows being generated by infrastructure assets are supported by very different commercial frameworks than the typical company within a global equities basket. Most infrastructure assets have their earnings or revenues linked to contracts or concessions with built-in inflation escalators, or have returns based on a regulated asset base with limited or no link to volumes or cyclical demand. Many regulated environments offer return formulae that allow the ability for an asset to earn a target return, regardless of market conditions and often detached from the economic cycle. This results in the cash flows and value of infrastructure behaving differently to general equities in both up and down markets, resulting in reduced correlations.
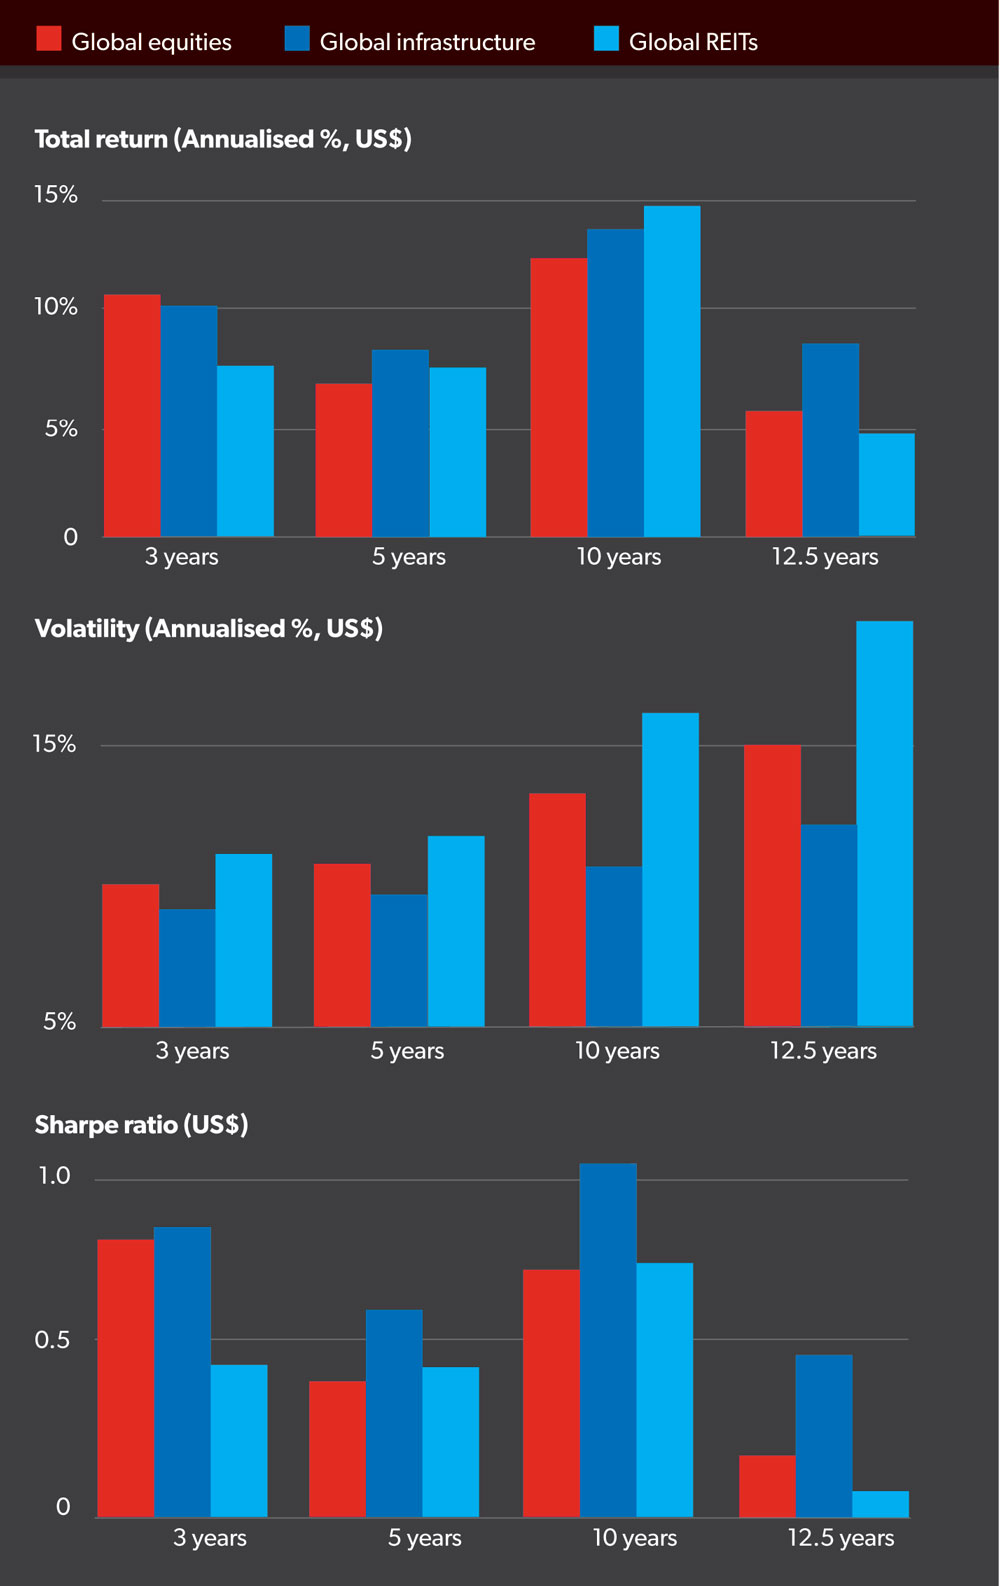
Modern portfolio theory suggests increasing asset diversification in a portfolio, for example, adding a strategic allocation to infrastructure, can help in reducing overall portfolio volatility. The march forward in time since our prior research on the role of infrastructure in a portfolio suggests little has changed. Our updated analysis reconfirms that global infrastructure over both shorter and longer time periods (Figure 1) has both lower volatility than and reduced correlations to global equities, as well as other asset classes.
Meeting specific risk-return objectives necessitates accounting for risks not only at the stock or investment level, but at a portfolio level, and so we believe ensuring reduced correlations between asset classes within a portfolio is an important step in this process.
Figure 1: Total historical returns, volatility and Sharpe ratio comparisons for global equities, global infrastructure and global REITs

Source: MBA GLI internal research: Bloomberg. Data to 31 Mar 2019. Past performance is not a reliable indicator of future performance.
Infrastructure has historically provided a strong risk-return outcome
As part of a diversified portfolio, investors allocating to global infrastructure may be able to improve both their portfolio performance and risk-return objective due to the more sustainable yields generally produced by global infrastructure and the lower inter-asset- class correlations and volatility.
Generally, in our experience we have seen investors look to infrastructure assets to deliver lower cash-flow volatility and higher earnings stability compared with broader global equities.
Steven Kempler
We believe global infrastructure can provide investors with lower volatility than certain asset classes over shorter and longer-term periods, on the basis that this asset class has historically been less volatile than global equities generally, which has also resulted in a higher Sharpe ratio for global infrastructure. This can be seen in Figure 1, which highlights not only how infrastructure has outperformed other key assets classes over multiple time periods, but also how it has done so at a lower level of risk, particularly evident over the longer time horizons.
These longer time periods include unprecedented economic events and sharp bouts of market weakness, such as the global financial crisis (GFC) of 2007/08 and the start of the European debt crisis of 2009, where the lower volatility, lower drawdowns and reduced correlations of global infrastructure would have been favourable to a broader portfolio. Even more recent events, such as the Brexit vote, increased levels of geopolitical stress or trade wars, have done little to affect returns.
Differences can be seen across strong and weak markets
Global infrastructure has historically provided a non-uniform return outcome. Traditional upside/downside capture ratios continue to support the notion that the asset class’s returns are disproportionately skewed between up and down markets.
Since index inception, global infrastructure has disproportionately outperformed in down markets compared with global equities. In up markets, global infrastructure has kept about 81 per cent of the upside, while in down markets, it has only seen 61 per cent of the downside. In an average up month, global infrastructure has lagged global equities by 0.5 per cent, but in an average down month global infrastructure has outperformed by 1.2 per cent.
Steep sell-offs are where the asset class shows its stripes
The large market correction in late 2018 is worth highlighting. During this period global equities were down 18 per cent in US dollar terms, while global infrastructure was down only 6 per cent. While there is, and always will be, an element of equity market beta embedded in global infrastructure, the differential in drawdowns is not unique or isolated to this single event.
Last year wasn’t a unique occurrence and investors may have learnt from the past to expect this. We have analysed each drawdown in global markets of 10 per cent or greater – peak-to-trough – and compared the returns to infrastructure over the same time frames.
Without fail, in each market sell-off, global infrastructure has exhibited better downside protection and capital preservation than global equities. Over an almost 15-year time horizon, global infrastructure has consistently outperformed in all severe market corrections.
It is interesting to note that even ignoring the GFC effect, the average outperformance of the asset class in such corrections is not materially affected – that is, about 6 per cent average outperformance over these distinct periods.
An analysis of the GFC impact on returns from a drawdown perspective is in itself interesting. While global infrastructure experienced negative returns during the GFC, the magnitude was materially less (10 per cent better) and perhaps more importantly the recovery time far shorter. It took three years from the market peak in October 2007 for global infrastructure to recover its capital – while global equities took around five-and-a-half years despite seeing a sharper initial bounce back from March 2009. Surprisingly, global REITs were similarly weak and took as long to recover. While many investors continue to bucket infrastructure and real estate into the same allocation, the return differences have historically been quite stark.
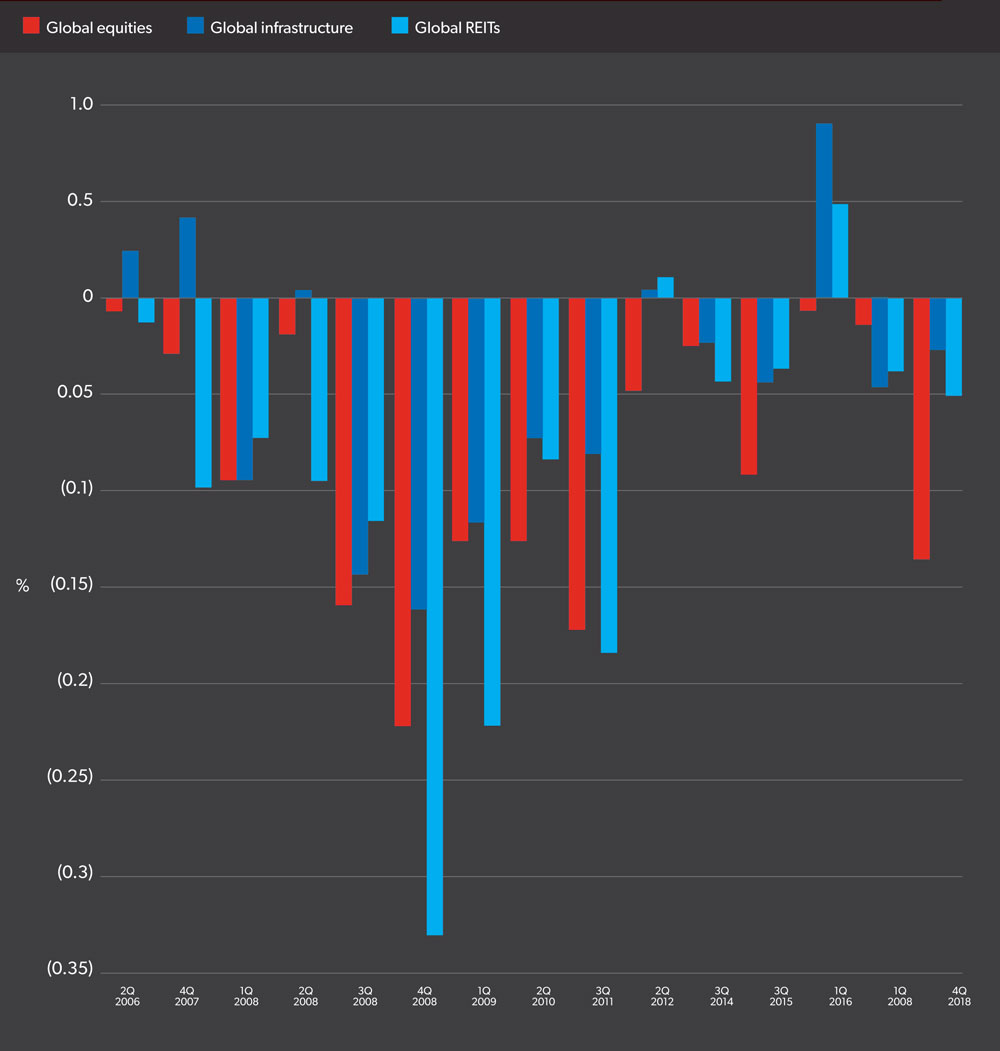
Looking at drawdowns in discrete quarterly periods is another way to highlight the defensive characteristics of global infrastructure as an asset class and further dispel the notion that all real assets (that is, REITs) are the same. While some view real estate and infrastructure as providing similar risk-return outcomes, our analysis of the data suggests they are actually quite different.
Figure 2 captures 15 discrete quarters during which global equity returns were negative. In 14 out of 15 periods, global infrastructure outperformed global equities. Yet global REITs only outperformed in seven out of 15 of these periods, that is, less than half the time. Global infrastructure and global REITs are clearly not the same.
Figure 2: Global infrastructure has outperformed global equities in 14 of the 15 negative quarters

Interestingly, in these weak periods, the average return for global equities and global REITs was surprisingly similar – not so the case for global infrastructure, which exhibited better downside protection.


