Ben Anderson provides an update of the current state of the domestic residential property market.
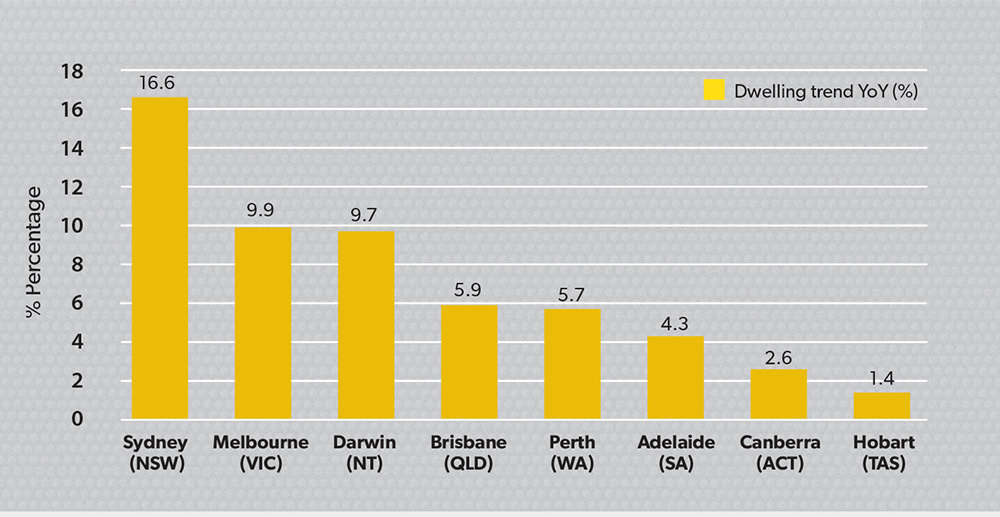
The annual change in the residential property market is now at 10.7 per cent, which is slightly above long-term growth trends.
Given the usual seasonal slowdown coming into winter and recent change in the stance of federal fiscal policy, the Australian residential property market recorded its first negative monthly change in a year, with -1.9 per cent growth in May, according to RP Data.
This was in contrast to the 0.7 per cent monthly change recorded in April. Dwelling values in the second quarter of 2014 are up 0.7 per cent, compared to a 2.6 per cent quarterly change at the close of April. Our view is that not too much emphasis should be placed on monthly volatility, and the fundamental growth drivers remain present.
The auction clearance rates weighted average across the capital cities, as recorded by RP Data, is now at 60 per cent (a higher figure was recorded by Australian Property Monitors (APM) at around 70 per cent), which is indicative of a robust market. Australian dwelling values are now 5.5 per cent, on average, across the capital cities, above their previous peak dwelling value.
A major positive of the seasonal slowdown is it provides flexibility for the Reserve Bank of Australia (RBA) to keep interest rates lower for longer, which should accommodate continued strength in the residential property market.
There was positive news after the recent release of gross domestic product (GDP) data. The economy grew by a seasonally adjusted 1.1 per cent over the first quarter of the year, nudging its annual change up to 3.5 per cent. This was compared to the December quarter, which closed at 0.8 per cent, and annual growth to the end of 2013, which was 2.8 per cent.
The growth figures were higher than expected and were led by strength in the mining sector, which accounted for 80 per cent of the growth figure. The RBA, in its recent meeting on 3 June, left rates on hold at 2.50 per cent again, stating “monetary policy is appropriately configured to foster sustainable growth in demand and inflation outcomes consistent with the target”.
The unemployment rate remained steady at 5.9 per cent in May, while the participation rate was adjusted down slightly to 64.7 per cent. The Westpac–Melbourne Institute Consumer Sentiment Index, which tracks consumer confidence, improved slightly by 0.2 per cent in June to 93.2 points from 92.9 points in May. Its move below 100 points was driven largely by the federal budget, with the index dropping 6.6 per cent in May from its pre-budget figure. The Australian dollar is now buying US$0.9373, which is 0.2 per cent higher than the exchange rate last month. The exchange rate improved after the recent release of the stronger-than-expected GDP data, but has since eased back to its current position.
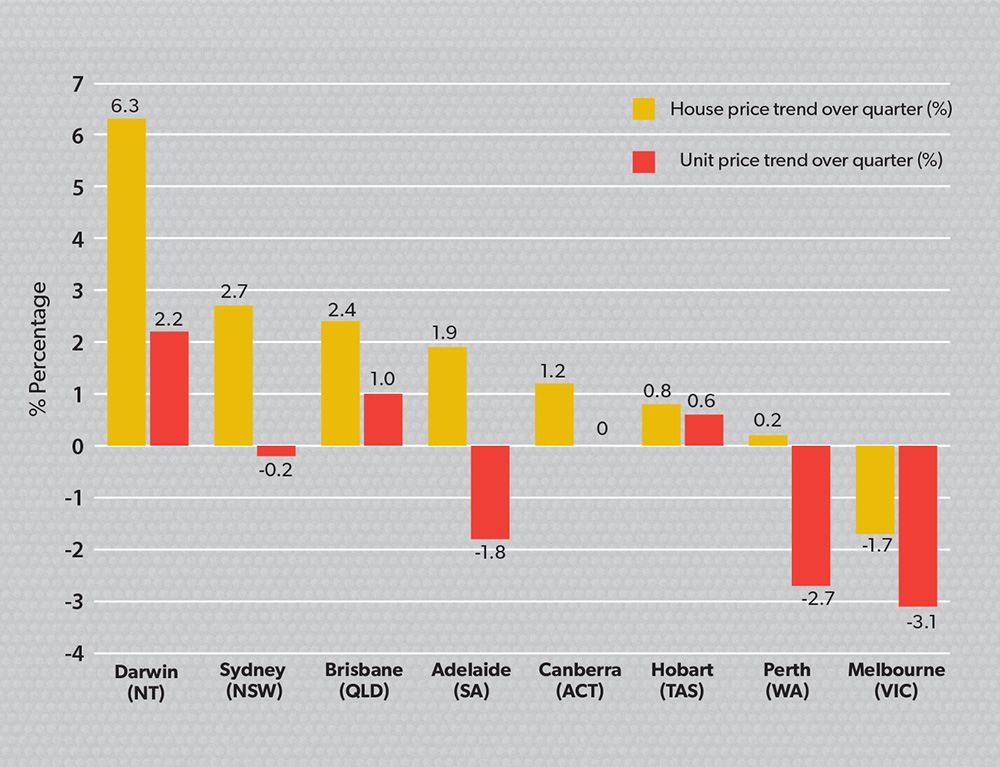
Median house and unit prices across Australia were at $575,000 and $480,000, respectively. They have recorded a trend of 0.7 per cent and -1.2 per cent over the past quarter, respectively. New home sales, as recorded by the Housing Industry Association (HIA), were up 2.9 per cent in April and 6 per cent over the past quarter. The HIA-Commonwealth Bank of Australia Housing Affordability Index moved favourably, shifting up 2.1 per cent over the March quarter, to be up 10.8 per cent annually. New dwelling approvals were up 15.1 per cent in the year to May, but dropped 1.6 per cent for the month.
Auction clearance rates
Auction clearance rates over the June long weekend produced above long-term average results for the major capital cities. Sydney’s results, as stated by APM, were at 74 per cent from 393 auctions that were tracked by the organisation. RP Data has recorded the figure to be closer to 66 per cent from 568 auctions for the week ending 8 June. The Real Estate institute of Victoria has yet to release figures for the long weekend, but its 1 June results showed a 73 per cent clearance rate from 897 auctions.
Melbourne recorded a 70 per cent auction clearance rate, according to APM, off 257 tracked auctions over the week. The RP Data clearance rate for the city was closer to 61 per cent off 333 auctions over the week. The Real Estate Institute of Victoria produced a 61 per cent result too, off 298 auctions. The differences among the results provided by auction clearance rate data recorders are often due to the differences in the way they collect and present data.
Nevertheless, the residential property market has cooled from its late 2013 and early 2014 highs, due mainly to the normal seasonal slowdown and softer consumer sentiment following the tougher budget stance. However, it is important to note international fiscal policies, such as that managed by the European Central Bank, have recently moved to employ negative interest rates. These rates are making it easier for Australian banks to access capital and funding, thereby allowing local consumers to access credit at cheaper rates. This improvement in affordability is likely to be an important driver, and likely to continue to provide a moderate and sustainable market growth rate in the near term.
Figure 1: Quarterly house and unit price trend (June)

Figure 2: Dwelling trend year-on-year (June)

Capital cities
For the first time in 12 months, dwelling values across Australia’s capital cities showed a monthly fall of 1.9 per cent in May, mainly contributed to by Melbourne, with a -3.6 per cent decline, which is not uncommon in the lead-up to the end of the financial year and the cooler climatic conditions of autumn. However, over the past quarter, capital city dwelling values are up more than 0.6 per cent. Over the growth cycle to date, which commenced in June 2012, capital city dwelling values are up 13.9 per cent, which has been largely contributed to by strong market conditions in Sydney (21.1 per cent).
The median national dwelling value can be split into the median house value, at $575,000 (slightly down on last month due to a weaker auction clearance rate since late February, when the capital city clearance rate hit 76 per cent), and the median unit value at $480,000 remains stable.
Sydney continues to be the dominant city, recording a median house value of $800,000 at the close of April, having progressed by 21 per cent per cent in the past year. Even though Sydney’s median unit price remained the same at $576,000 for the month, despite of a small $2000 reduction in the house value, Sydney still remains the most expensive city in Australia.
The most positive outlier for the three months ending May was Darwin, with the highest rental yields (5.8 per cent for both houses and units) and 5.5 per cent capital growth.


