


Infrastructure investments can form an important defensive element within an SMSF portfolio. The key to this outcome is to select the type of assets that can truly play this role, says Andrew Maple-Brown.
In an environment of considerable market volatility, investors globally are searching for defensive portfolio solutions. As such, infrastructure investments have gained greater focus in recent years as investors are drawn to the defensive characteristics of the sector. Inflation protection, reduced volatility (relative to broader equity markets) and portfolio diversification benefits are among the core tenets of what an infrastructure approach has to offer. But investors face a dilemma: will an expected defensive asset actually deliver these defensive characteristics when required?
The defensive aspects of an infrastructure asset
The defensive components of infrastructure investing can be found in the essential service nature and strong strategic positions of the underlying assets. Generally the revenues of infrastructure assets have a natural link to inflation, which can lead to a level of inflation protection. From a portfolio perspective, the long-dated cash flows from infrastructure assets are regarded as an effective match for long-dated liabilities, while the lower correlation to traditional asset classes can provide diversification benefits. These defensive characteristics have long been central to the infrastructure investment narrative.
Are all infrastructure assets defensive?
Naturally different assets possess varying degrees of the defensive components of infrastructure. These differences have commonly been observed within academic research of the sector. The extent of this variance is often misunderstood. A review of the historical performance, volatility and correlation data of the main global listed infrastructure (GLI) indices demonstrates this. Even more apparent is the variance in performance of the GLI indices during the global financial crisis (GFC).
A background to infrastructure indices
There are several commonly used GLI indices. Until recently the most frequently used were:
- Dow Jones Brookfield Global Infrastructure Index (DJB),
- UBS Global Infrastructure and Utilities 50-50 Index (UBS 50/50), and
- Standard & Poor’s Global Infrastructure Index (S&P).
The UBS 50/50 was terminated in May 2015, which provided an opportunity for industry participants to develop an index that more accurately reflected the opportunity set. The resulting index is the FTSE Global Core Infrastructure 50/50 Index (FTSE 50/50 Index), now the most widely used GLI index globally.
The index has historical and performance data dating back to 2009 and so for the evaluation of performance during the GFC, our analysis has used the original, uncapped version of the index (from which the FTSE 50/50 Index was developed). Both indices were comprised of the same constituents with their difference being in stock weightings (due to the sector and stock caps that were introduced) and, as such, the performance data remains closely linked.
Concurrently with the FTSE 50/50 being developed, a new infrastructure index was launched by MSCI, the MSCI World Core Infrastructure Index.
Performance during the GFC
Figure 1: Comparison of index returns
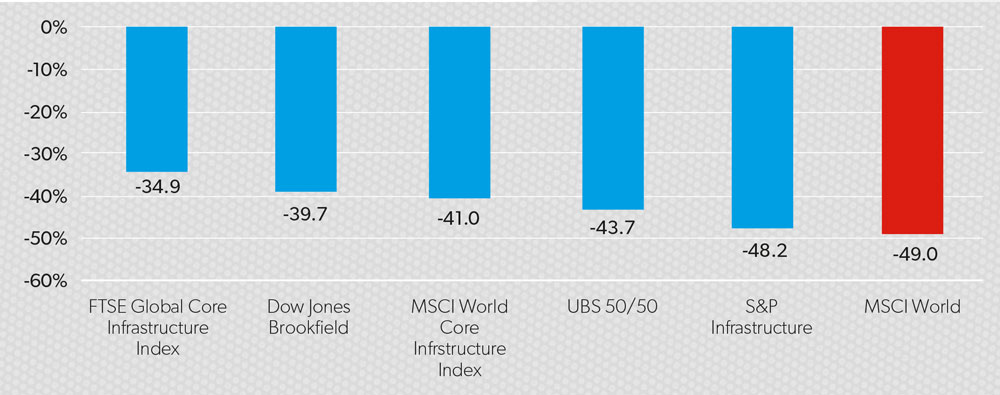
31 December 2007 to 11 March 2009 (A$ Hedged). Sources: Bloomberg, Factset.
Table 1: Statistical comparison of five main infrastructure indices (five years to 31 March 2015)
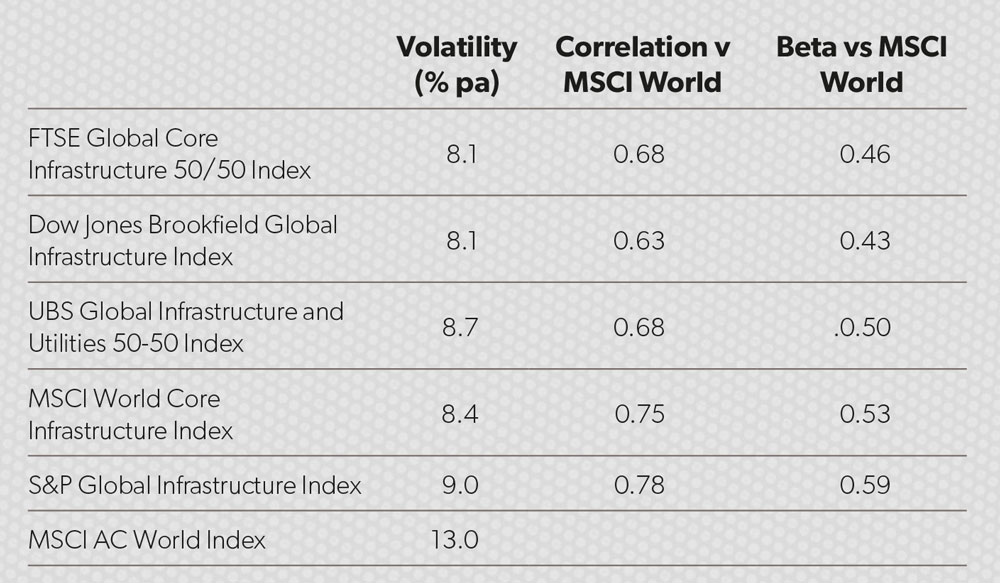
Sources: Bloomberg; FTSE; MSCI; MBA GLI calculations based on original data sourced from index providers.
Table 2: Calculations of infrastructure ‘purity’ of the main indices (as at 31 March 2015)
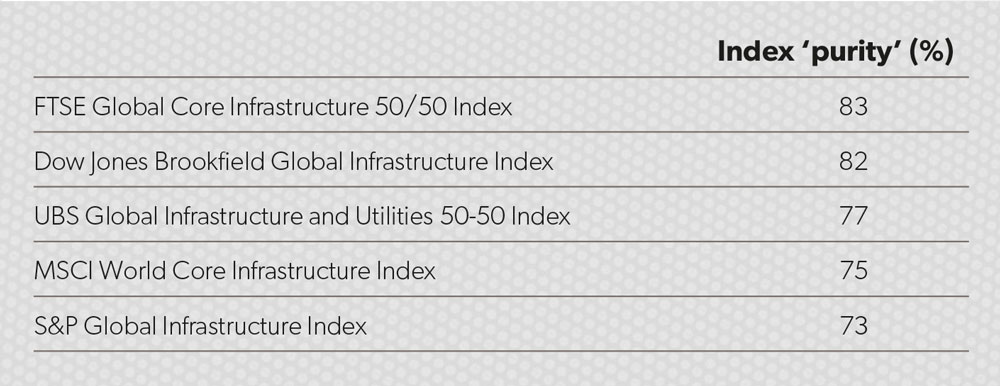
Sources: Bloomberg; FTSE; MSCI; MBA GLI calculations based on original data sourced from index providers.
On the whole, equity indices peaked very late in 2007 before bottoming out on (or very close to) 11 March 2009. Figure 1 compares the performance of the infrastructure sector from 31 December 2007 to 11 March 2009.
The MSCI World Index was down 49 per cent during the period. The extent of variance in the performance between the main infrastructure indices is striking. In particular, the difference between the strongest-performing infrastructure index (FTSE Global Core) and the weakest (S&P Infrastructure) was extreme. The S&P index only marginally outperformed global equities during this period, falling short of its supposedly defensive characteristics, while the FTSE index delivered outperformance of about 14 per cent. The key point is investors’ perception of the performance of listed infrastructure during the GFC was hugely affected by the investment strategy they had chosen or the infrastructure index they viewed as a proxy for the sector’s performance.
Statistical comparison of indices
The same pattern is reflected with more recent data. Table 1 reveals large statistical differences between GLI indices beyond the GFC when comparing the volatility, correlation and beta of five main infrastructure indices.
Overall, infrastructure indices have demonstrated substantially lower volatility and beta relative to global equities, along with diversification benefits. More specifically, the divergence in the performance of the five main indices across these three key defensive indicators (volatility, beta and correlation to equity markets) stands true today.
What causes this variance in defensiveness?
The divergence in performance in the infrastructure sector should not be viewed as an aberration. Infrastructure indices are constructed with different index methodologies and the investment characteristics of assets that are typically classified as ‘infrastructure’ can vary materially. The factors within each of the index construction methodologies include, for example, the regional and sector allocations of the various indices.
But above all others, we believe the largest factor that impacts on the defensiveness of the sector is the definition of the investable universe itself and of second most importance is the influence of corporate governance.
The importance of how infrastructure is defined
Our view is that if the key objectives of lower volatility and inflation linkage are not focused on throughout the investment process, investment outcomes may tend towards that of broader equity markets.
This hypothesis has been tested by considering the infrastructure purity of each of the main infrastructure indices, where purity refers to the extent the constituent assets within each index exhibit the key infrastructure characteristics. A detailed review of each stock in the main GLI indices has been conducted, calculating the exposure of each company to different infrastructure asset types. The results of the analysis of the infrastructure purity of the GLI indices is shown in Table 2.
The purity of the indices correlates very closely to the volatility of the indices – both during the GFC and over the past five years. The index with the least purity is the S&P Infrastructure Index and, indeed, it was this index that experienced the largest declines during the GFC and exhibited the highest volatility over the past five years.
The index with the greatest purity was the FTSE 50/50 Index – the sister index of which was the strongest performer through the GFC and exhibited the equal lowest volatility of all the indices over the past five years. The DJB Index was the next best on all measures, while the UBS and MSCI Infrastructure indices scored very closely.
Clearly the definition of infrastructure used by an index has a very large impact on the defensiveness of the asset class.
Infrastructure assets are typically defined by their physical characteristics. Although this is one factor to consider, the more important consideration is the commercial frameworks that underpin the asset. Typically, the existence of commercial frameworks provides a monopolistic position that leads to the asset’s defensiveness.
Both integrated utilities and stevedoring companies are good examples of assets frequently referred to as infrastructure, but which should not be included in an infrastructure definition. The FTSE 50/50 and DJB indices only include utilities that are regulated (or largely regulated), while the other indices also include integrated utilities.
Figure 2: Returns of externally managed vehicles, 31 December 2007-11 March 2009 (Local terms)
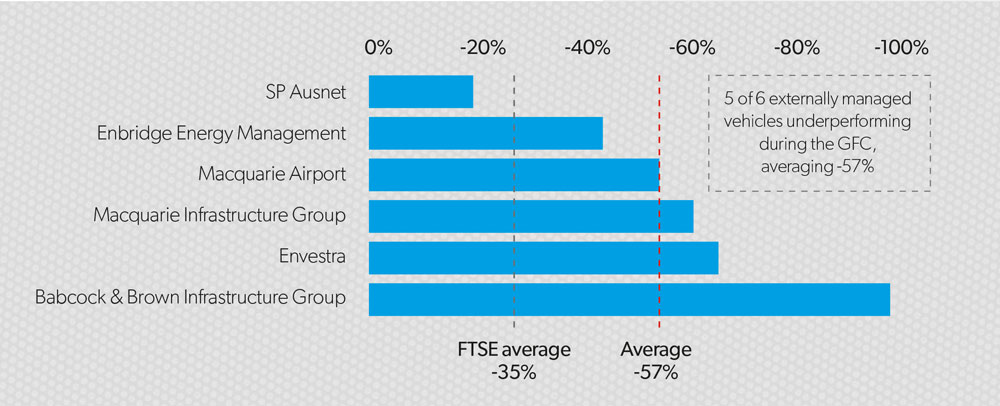
Source: Bloomberg.
Stevedoring companies and ports
An example of a sub-sector that is universally included among infrastructure indices, but which remains contentious among some investment managers, are ports.
Such assets are referred to as ports – both in relation to (a) the freehold owner of the port and (b) the concessionaire that has the right to operate the port. The freehold owner of the port has a very long-dated asset that is in a strong strategic position and is subject to long-term contracts (to the concessionaires), so well fits the definition of an infrastructure asset. However, the freehold owner is most typically a government entity and there are virtually no such assets listed on global stock exchanges (Westshore Terminals in Canada and the Port of Tauranga in New Zealand are exceptions).
The other listed companies that are referred to as ports are actually stevedoring companies. They do not own the port or its hard infrastructure.
Instead, they have been granted a concession to operate at the port for typically around 25 years. In most cases the port has granted concessions to multiple stevedoring companies and so these stevedoring companies compete for the business of only a small number of shipping alliances. The contracts they have with these customers are short-dated and, considering the extremely cyclical nature of shipping volumes, their pricing power is low.
For all these reasons, stevedoring companies do not appear to possess the defensive characteristics typically exhibited by infrastructure assets. This view is supported by the performance of these assets during the GFC. In 2009, for example, global gross domestic product was down 2 per cent, yet World Bank World Development Indicators showed port volumes in Germany were down by a massive 23 per cent, and those in Hong Kong down 14 per cent. Such volume sensitivity is not supportive of stable cash flows or defensive investments.
Further, with the shipping lines facing extreme pressure at that time, the revenues earned per container by the stevedoring companies also dropped. This drop in revenues per container exacerbated the volume fall, and so resulted in dramatic decreases in earnings.
For these reasons, we believe stevedoring companies do not have sufficient market power to be appropriately referred to as infrastructure assets and that the inclusion of these assets in an infrastructure definition is likely to materially impact the level of defensiveness achieved.
The importance of corporate governance
Another key factor when considering the defensiveness of the asset class is corporate governance. It is critical when investing in any asset class that investors are aligned with the other owners and management of investee companies, and sufficient shareholder protections are in place were that alignment to ever be tested. It is of heightened importance for infrastructure investing, considering:
- the long-dated nature and large capital sums invested in individual infrastructure projects, meaning the impact on investors from bad capital allocation decisions is greater; and,
- the public nature of the assets and the historical ownership of many of the assets being in the public sector, causing the potential for diverging interests between government owners and private investors.
An analysis of the performance of the infrastructure sector during the GFC highlights the impact governance can have on the defensiveness of the sector. For example, externally managed vehicles, due to the potential misalignment of interests that this structure can create are of concern. During the GFC, there were six such vehicles within the FTSE Global Core Infrastructure Index and five of these six underperformed the index as a whole (Figure 2). Their average performance was 22 per cent below the index.
Similarly, companies controlled by government entities carry the risk they are partly managed to achieve public policy objectives instead of being solely focused on the interests of shareholders. These companies are consequently less likely to exhibit defensive characteristics as the risk of a divergence in the interests of the government and private shareholders is greatest during times of market stress.
Summary
In summary, the defensive characteristics of the infrastructure sector are well proven. The performance of the sector during the GFC and more recently supports this point. For example, the FTSE Global Core Infrastructure indices (on an A$ hedged basis) outperformed global equities by about 14 per cent during the GFC and, over the past five years, exhibited (a) volatility of nearly 40 per cent less than global equities (8.1 per cent versus 13.0 per cent) and (b) a beta of 0.46 relative to global equities.
However, the defensiveness of the sector has not been uniform. It has exhibited considerable variances in key characteristics such as volatility, beta and correlation to broader equity markets and, moreover, in investment returns. The S&P infrastructure index performance disappointed during the GFC and its recent performance has similarly been far more closely tied to the performance of the broader global market.
The two factors in particular that drive this variance in defensiveness in our view are the definition of infrastructure used and the role of corporate governance. For investors considering the infrastructure sector from the perspective of a defensive equity investment, focusing on the investment strategy’s approach to these two factors is important to achieve the defensive characteristics being targeted.