SMSF trustees in retirement face the dilemma of knowing how much of their savings they can spend before they run out. Melanie Dunn highlights how stochastic modelling can assist in formulating a more accurate picture of sustainable spending patterns.
As SMSF practitioners know, retirement is a very different proposition to accumulation. While accumulation is about saving and investing, retirement is about spending the right amount of money to last you a lifetime. While both retirement and accumulation are subject to market risks, there are greater risks in retirement and these risks can have a greater impact. Retirees face risks such as inflation, sequencing and longevity risk that can significantly affect the chances of meeting their retirement goals.
There are a variety of financial models available to assist SMSF practitioners in setting retirement plans for their clients. Ideally these models should provide an indication of the likelihood of their plans being successful and their clients not running out of savings before they pass away.
Traditional models assume fixed investment returns or fixed lifespans. But nothing is fixed in life and these models do not take into account the real-life risks faced by retirees. Rather than relying on these projections, SMSF practitioners should consider stochastic models that look at a range of different scenarios. Such a model can more accurately estimate the likelihood that clients can achieve their retirement objectives.
While it is intuitive, the more a household wants to spend each year in retirement, the more assets they will need to sustain that spending for life. The trade-off between spending and sustainability is quite complicated.
Due to tax, investment returns, life expectancies and the age pension means tests, there is no easy rule for how much extra can be spent each year from every extra dollar in retirement savings.
Having a means to assess this trade-off to allow for clients’ individual circumstances is a valuable service to offer.
Case study assessing an SMSF couple’s sustainable retirement
Consider George and Catherine:
- George aged 65, Catherine aged 60
- $2 million in total wealth
- $1.6 million in an SMSF invested in the ATO average asset allocation
- $400,000 outside of superannuation in a balanced share portfolio
- Desired budget in retirement: $100,000 a year, increasing each year with inflation.
George and Catherine have recently retired and want to understand whether their retirement budget of $100,000 a year is sustainable for the rest of their lives. Rather than relying on a traditional model (with fixed assumptions), which ignores the risks, they choose to use a stochastic model, which considers thousands of different scenarios, based on what their lifespans might be and what investment markets might do.
Assessing the household’s wealth over retirement
The stochastic model shows George and Catherine the outcomes of the 2000 scenarios considered. This helps to illustrate the volatility of investment markets and wide range of possible outcomes in their retirement.
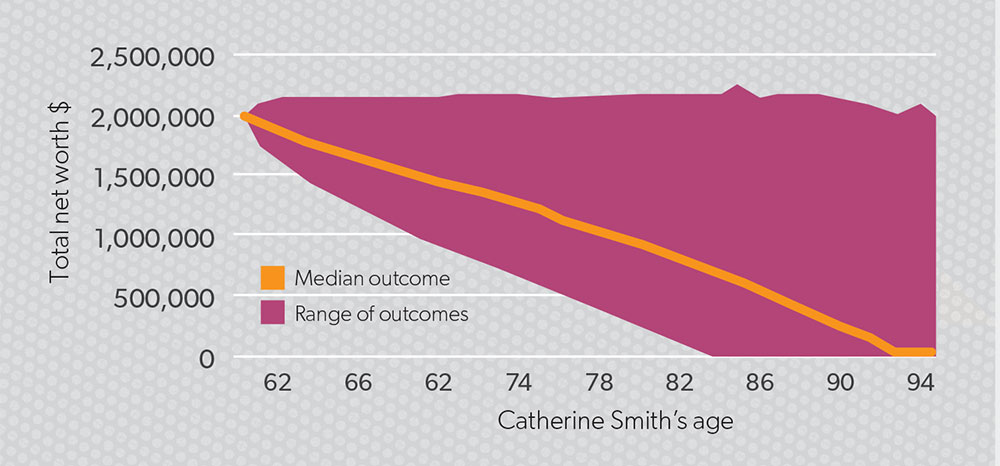
The purple shaded area in graph 1 illustrates the range of total savings we expect George and Catherine to have at each age with an 80 per cent chance. The orange line on the graph shows the median outcome – the middle total savings at each age.
Graph 1: Range of future net worth

The bottom of the shaded range represents the tenth percentile – the lowest 10 per cent of outcomes for George and Catherine’s total savings at each age. The couple ran out of assets by age 84 or before in the worst 10 per cent of outcomes modelled.
In the best 10 per cent of outcomes (the top of the purple shaded range), George and Catherine still had around $2 million in assets left at age 95 despite spending their desired $100,000 a year.
The width of the shaded range illustrates the effect of the wide range of possible investment returns on the household’s assets, based on their investment mix and level of spending. This demonstrates there is not just one path through retirement like that suggested by traditional models. Selecting a less volatile investment strategy would reduce the range of possible outcomes, but may also reduce the potential upsides.
Understanding the couple’s life expectancy
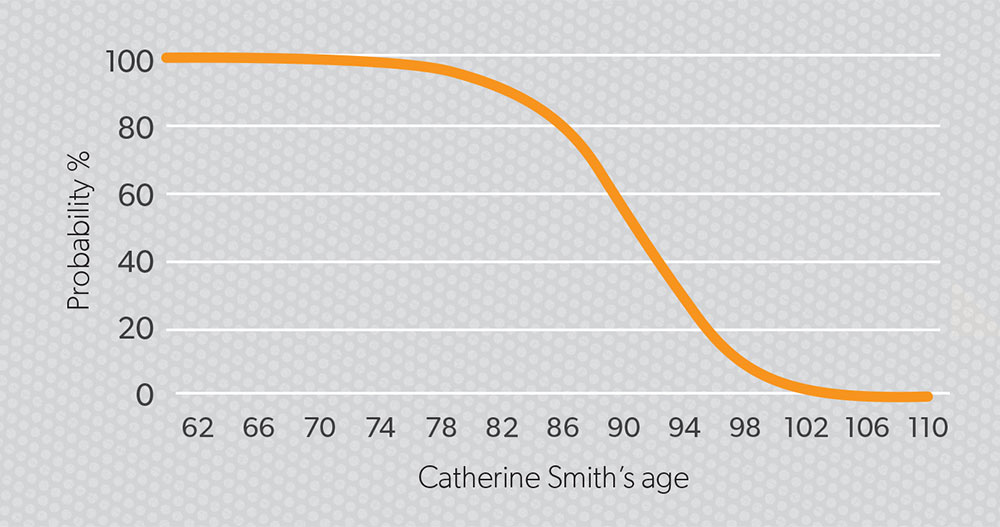
Graph 2 illustrates the likelihood that at least one of George or Catherine is alive at each age into the future.
Graph 2: Chance that one of you is still alive

These likelihoods sit on a curve. There is a chance at least one of the couple will still be alive at all of these different ages. Selecting just one age as the time frame of retirement is like picking a fixed investment return. It’s very unlikely to be George and Catherine’s actual outcome. It is important to look at the range of life expectancies that might be experienced as part of a retirement assessment and consider the probability of living to these different ages.
Determining the sustainability result
The two graphs illustrate the three key retirement risks – investment risk, inflation risk and longevity risk. The next step is to combine these results to ascertain whether George and Catherine can confidently afford to spend $100,000 a year for life.
The stochastic model looks at in how many of the 2000 scenarios George and Catherine are able to spend their desired budget of $100,000 a year for life without running out of money.
The outcomes provide George and Catherine with a medium retirement sustainability result of 60 per cent. This means they could only sustain this level of spending in 60 per cent of the scenarios.
If they continue spending $100,000, George and Catherine would be accepting a two in five chance they would run out of money and be reliant solely on the age pension.
Achieving a sustainable retirement
George and Catherine are now better able to understand the trade-off between spending and sustainability. The amount of risk retirees are willing to accept around the sustainability of their retirement plans depends on their personal risk tolerances. For George and Catherine, having a two in five chance of running out of money is taking on too much risk – they would feel a lot more comfortable with a probability of success of 80 per cent or higher. They also identify they would like to have $200,000 in assets left over when they pass away to bequest to their children.
George and Catherine complete a budget to determine how much they need to live on in retirement. The budget determines that an income of $65,000 a year (keeping pace with inflation) would cover their needs, but ideally they would like to enjoy their retirement and spend a little bit more.
The stochastic model is again used to analyse whether George and Catherine can afford a retirement that meets their needs based on a spending plan of $65,000 a year, increasing with inflation and taking into consideration a bequest of $200,000 remaining when they both pass away.
This spending plan provides a sustainability result of over 95 per cent, a very high level of confidence.
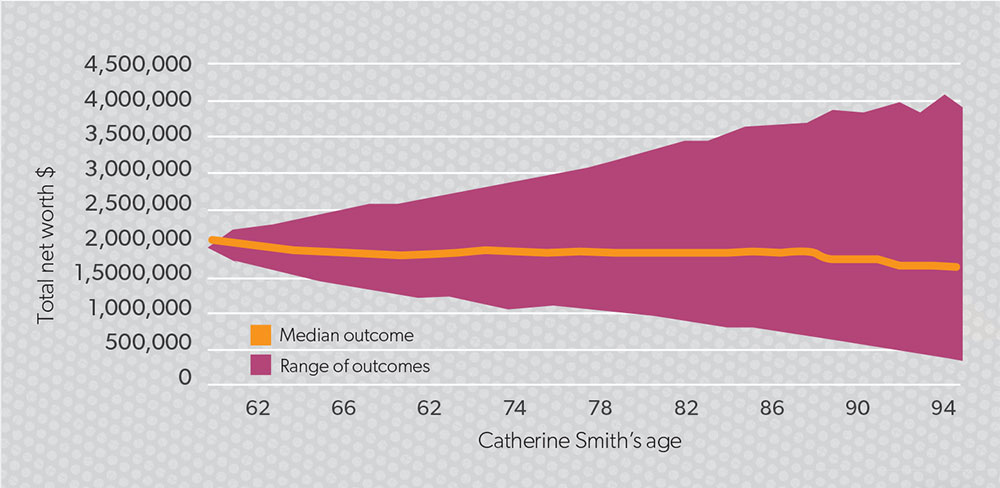
There is a less than 5 per cent chance of having assets less than $200,000 when both George and Catherine pass away. The range of future net worth graph (graph 3) confirms this high confidence level. Even in the worst 10 per cent of scenarios (the bottom of the purple shaded range), the couple does not have assets below $200,000 up to the age of 95.
George and Catherine can be very confident of achieving a retirement that meets their needs and want to experiment further to determine how much more they could confidently spend.
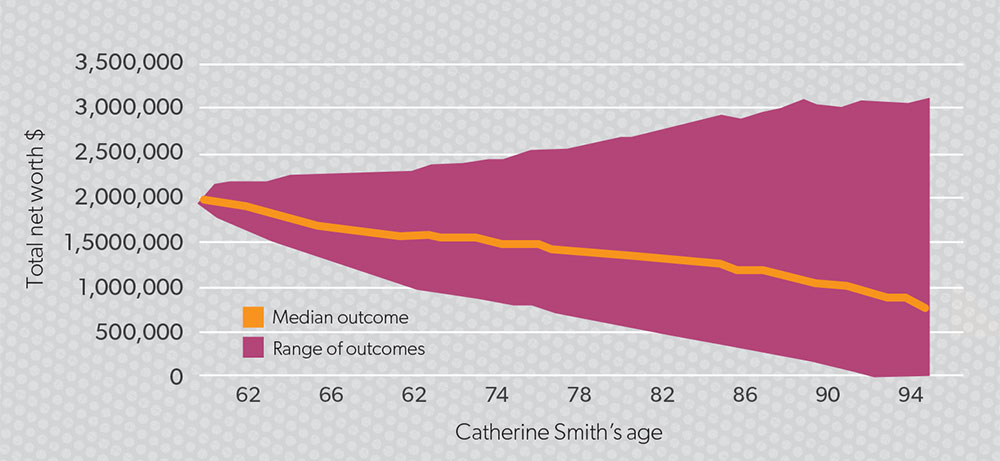
They consider a new scenario of $90,000 a year for the first 10 years of their retirement, so they can travel and do renovations while they are still young and active. Then after 10 years they believe they will be able to reduce their spending by 15 per cent to $76,500 a year (in today’s dollars) for the remainder of their retirement.
Based on this spending plan, graph 4 shows the household has a retirement sustainability result of 82 per cent.
George and Catherine are happy to have identified a spending plan that takes into account risk and provides a high degree of confidence that it will be sustainable for life and still provide $200,000 for their children.
Graph 3: Range of future net worth

Graph 4: Range of future net worth

Opportunities to address client needs
The SMSF market is constantly evolving through technological advancements and education. There is a consistent need across the market to improve efficiencies and practices, while achieving growth and expanding offerings. Practitioners are able to identify the best practices for their organisation and best results for their clients.
Investment Trends research indicates there is a gap in the market for retirement planning tools that assess retirement sustainability, however, models do exist and are currently available. A stochastic model allows an SMSF practitioner to make informed decisions about their clients’ retirement. These models can be tailored to meet clients’ individual needs and wants. They can be used for retirement cash-flow planning as part of a regular review to check that clients remain on track to meet their retirement goals.


